X-ray Fluorescence Analysis
Julia Martín[math]^{1,\dagger}[/math], María José Navas[math]^{2}[/math], Ana María Jiménez[math]^{2}[/math] and Agustín G. Asuero[math]^{2}[/math]
[math]^{1}[/math]Department of Analytical Chemistry, Escuela Politécnica Superior, University of Seville, 41011-Seville, Spain, EU.
[math]^{2}[/math]Department of Analytical Chemistry, Faculty of Pharmacy, University of Seville, 41012-Seville, EU.
[math]^{\dagger}[/math] Corresponding Author.
An overview of XRF (X-Ray Fluorescence) is given, mainly paying attention to the X-ray production process, XRF instrument configurations, sample handling, matrix effect and quantitation, development and challenges, and applications.
Contents
1 Introduction
X-ray science has a prosperous history. Wilhelm Konrad von Röntgen, a German physicist and rector of Julius Maximiliam Wurzburg University (Assmus, 1995; Dörfel, 2010; Hurwic, 1980; Seliger, 1995), at age 50 made the accidental discovery of X-rays on the evening of Friday the eighth of November 1895, while working in the dark with cathode rays (gaseous discharge Crookes tube at high voltages). He called them “X rays” because he did not understand their origin. This name prevails in English-speaking areas, whereas the name “Röntgenstrahlen” is used in German speaking parts in honour of Röntgen. For his discovery, in 1901, Röntgen was awarded the first Nobel Prize in physics. In Lennep, birthplace of Rontgen, located 50 km from Dortmund, was founded in 1932 the "Röntgen Museum". Six different Nobel Prizes were awarded (Galli, 2014; Palmer, 2011) in the early 1900’s concerning the topics of X-rays (discovery, diffraction, and spectrometry).
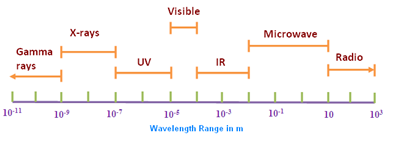
Many instrumental techniques are based on a continuous range of wavelengths (or energies) that nature provides (Anzelmo et al., 2013). The X-ray region occupies in the electromagnetic spectrum (Fig. 1) an area of high energy and short wavelengths, between [math]\gamma[/math]-rays and ultraviolet light, which range approximately from 0.012 to 31 nm (40 eV to 100 keV). The X-ray region may be subdivided (Dolenko et al., 2017) into short wavelength ([math]\lambda \leq [/math] 0.2 nm), long wavelength (0.2 [math] \leq\lambda \leq [/math]2 nm), and ultralong wavelength ([math]\lambda \gt [/math] 2 nm). Note that 1 nm = 10[math]^{-9}[/math] m and 1nm = 10 Å (Ångstroms). The medical field is where X-rays found its early applications (Mattsson and Börjesson, 2008; Mould, 1995). Within three months of Röntgen’s original publication (December 28th, 1895), X-rays were routinely used as an aid to surgery in a hospital in Vienna (Whiston, 1987, p. 4). The German dentist Walkhof presented the first dental radiography (Demirdjian, 2007) on January 23th, 1896, only two weeks after the communication of Röntgen to the Würzburg Physical Medical Society. The X-rays discovery, as well as their analytical applications, remained ignored until 1913, as we may see later. However, in the past 50 years or so, new applications such as the analysis or materials characterization have emerged.
There are a number of approaches (Jenkins, 2000a) to X-ray analysis. In X-ray absorption, the absorption of energetic X-rays, that occurs when an electron is removed from its orbital, is related to the concentration of absorbing species in the sample irradiated. A definite proportion [math] \left ( I/I_{0} \right ) [/math] of the incident radiation [math]I_{0}[/math] can pass through a layer of thickness [math]\tau[/math](cm) and density [math]\rho[/math] (g/cm[math]^{3}[/math]) (absorber), the wavelength [math]\lambda[/math] of the transmitted beam remaining unchanged. The intensity [math]I[/math] of the transmitted beam is given (Bouguer-Lambert-Beer law) by [math] I=I_{0}\exp \left ( -\mu \rho \tau \right )[/math], where [math]\mu(cm^{2}/g)[/math] is the mass absorption coefficient and the product [math]\mu\rho[/math] is the linear absorption coefficient [math](cm^{-1})[/math] (Thomsen, 2007). For a given element and wavelength, [math]\mu[/math] is a constant, independent of the chemical and physical state of the element. In many handbooks, monographs, on the web, and in research papers, tables of mass absorption coefficients at various wavelengths for different elements can be consulted. For example, the total mass absorption coefficient is given by [math]\mu _{T}=\sum \mu_{T}\; w_{i}[/math], where [math]w_{i}[/math] is the mass fraction of the ith element present in the sample. However, the mass attenuation coefficient (taking into account both X-rays absorption and scattering) should be used (Robinson, 2005) for accurate quantitative work. Undoubtedly the techniques of absorption are the least used of all those that use X-rays, although they are useful in some cases as in elemental analysis and thickness measurements.
In X-ray emission spectroscopy, the sample is bombarded with an electron beam in an X-ray tube and the emitted X-ray photons are measured. In practice, this technique is used poorly since the sample should be placed in the X-ray tube. Measurements are generally restricted to qualitative or, at best, semi quantitative determinations because of the heating and selective volatilization of different elements by the impinging electron beam. However, this is the basis of X-ray microanalysis using an electron microprobe or a scanning electron microscope.
In X-ray fluorescence, or secondary X-ray emission, the sample is bombarded with an X-ray (primary) polychromatic beam of short wavelengths, e.g. the continuous radiation from an X-ray tube, and the reemitted (secondary) X-radiation (of longer wavelengths) is measured. The wavelengths thus emitted are equal to those that result from excitation produced by electron bombardment. The difficulties found in using X-ray emission for quantitative analysis are not experienced in X-ray fluorescence (XRF) so this technique is widely used for analytical purposes and perhaps XRF is the most important of all X-ray analytical methods.XRF is really a surface technique since the primary beam doesn’t penetrate very far into the specimen, usually a few micrometres for a heavy element such as gold, and to about half a millimetre for aluminum, a lighter element (Whiston, 1987).
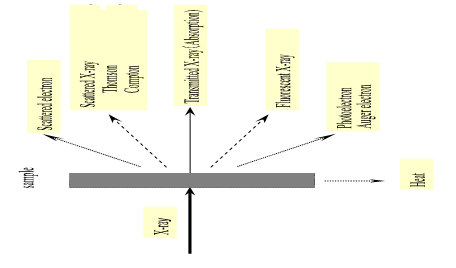
Therefore, when X-rays pass through the matter a number of processes may occur: absorption, scatter, and fluorescence (Fig. 2). X-rays are electromagnetic radiation and can be manifested in two forms, as characteristic and continuous radiation. Charles Glover Barkla proved indirectly in 1906 that the radiation emitted from a sample consists of several spectra of different wavelengths that named K and L spectra. Barkla was awarded the Nobel Prize in physics in 1917 “for his discovery of the characteristics Röntgen radiation of the elements”, as stated by the Nobel Committee. An inner electron may be ejected when a sample is bombarded with high-energy particles, which entails the transition from states of high to low energy of the orbital electrons with the subsequent production of the characteristic radiation (Jenkins, 2000). High-energy electrons approaching the electronic clouds surrounding the nucleus undergo a deceleration, leading to continuous (the continuum or Bremsstrahlung) radiation. The detectability of small peaks by continuous radiation is limited due to the presence of background.
The basis of X-ray radiography is absorption; the heavier elements (high atomic number, Z) weaken the beam to a greater extent than the lighter ones (low Z). X-ray absorption is used (Robinson, 2005) in the nondestructive evaluation of flaws in objects (voids or internal cracks in metals, cavities in teeth, broken bones in humans…), a technique called radiography or X-ray fluoroscopy. This same technique is used to perform security screening of baggage at airports. A computerized version of radiography, computed tomography (CT) scanning or computed axial tomography (CAT) scanning, provides a powerful, high-resolution medical diagnostic tool (of certain disorders in their early stages) by giving a 3D cross-sectional image of body tissues on less than 30 minutes. X-rays damage living tissues, a property which find use in radiotherapy, where malignant growths, which are not able to be removed by surgery, are destroyed in situ, using X-ray beams (Robinson, 2005; Whiston, 1987).
Diffraction patterns obtained through the scattering of X-rays by many solid materials are a special feature of a compound, which is closely related to the atoms’ molecular arrangement, being used to study their crystalline structures, composition, particle size, decomposition (evidence of), polymorphism, preferred orientation, or disorders (Whiston, 1987, p. 2). In this case, the wavelength of the X-rays does not vary, and a diffraction figure is only formed if certain geometric conditions occur, expressed by the law of Bragg or in the conditions of Laue. X-rays wavelengths are comparable to atomic spacing, in this way proving to be a powerful tool for ascertaining the atomic structure of matter (and atoms). This serves as the basis of X-ray diffraction analysis; qualitative identification of crystalline materials is readily made from a measurement of the angles of diffraction. X-ray diffraction also serves as a mean of isolating X-rays of a particular wavelength in an X-ray spectrometer. In 1912, German Max von Laue (together with M. Friedrich and P. Knipping) working with crystalline copper sulphate, made the fundamental discovery of X-ray diffraction (Forman, 1969), a powerful mean of materials characterization. Meanwhile, an alternative method (Eckert, 2012) to confirm the discovery through the interpretation of diffraction as a reflection on selected net planes in the crystal according to the equation [math]2d\sin \theta =n\lambda [/math] was developed by William Henry Bragg and William Lawrence Bragg in England (d is the distance between planes in the crystal, [math]\lambda[/math]the wavelength of the incident beam and the integer n the order of the diffraction pattern). Within about a year it became clear (Jenkins, 1984) that two new sciences, X-ray crystallography, and X-ray spectroscopy, had emerged. Max von Laue was awarded the Nobel Prize in 1914 “for his discovery of the diffraction of X-rays by crystals” and the Braggs received it one year later “for their services in the analysis of crystal structure by means of X-rays” (Thomas, 2012).
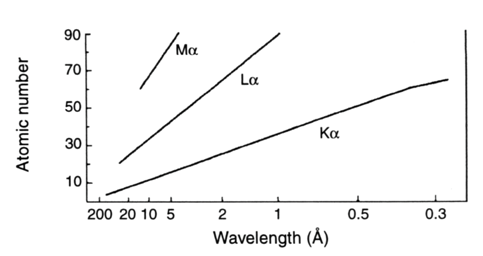
Fluorescence occurs when energetic radiation ejects an inner shell electron creating vacancies in the specimen. Electrons from the outer shells fill then these vacancies. As a consequence, a fluorescent radiation characteristic of the elements that make up the specimen is emitted at specific X-ray wavelengths. XRF spectroscopy has as an object the isolation and measurement of the set of wavelengths that follows the excitation by the X-ray primary beam. Subsequent these vacancies are filling by electrons from the outer shells. The principle is known since 1913 when Henry G.J. Moseley (University of Manchester, and Oxford) found the relation between [math]Z[/math], and [math]\lambda[/math], of the characteristics X-ray emitted. After recording the X-ray spectra of numerous elements, he found that the frequency of emission lines is a function of the Z squared, [math]\nu =c/\lambda =a\left ( Z-\sigma \right )^{2}[/math], where [math]a[/math] and [math]\sigma[/math] are constants depending on the spectral series of the given emission line.
Svante August Arrhenius, the Nobel Laureate in Chemistry for 1903 and one of the most influential members of the Nobel Committees for Physics and Chemistry (Crawford, 1984) nominated Moseley in 1915 for the Chemistry Prize. However, Moseley was killed (August 1915) in action as telecommunications officer at the age of 27 in the Gallipoli campaign during World War I (Margaritondo and Ramachandra, 2015). The impact of Moseley’s law on chemistry was crucial, playing a key role (Sarton, 1927) in the numbering of chemical elements, helping to explain a few atomic weights inversions in the periodic table (Ar-K, Cu-Zn and Te-I), giving rise to the atomic number term, and helping to predict and find six new elements in the next twenty years (Tc, Hf, Re, At, Fr and Pm).
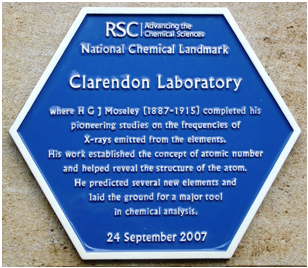
Moseley built the early X-ray spectrometer, based on a cold cathode tube where the air within the tube provided the electrons serving the analyte as the tube target (Bounakhla and Tahri, n.d.). Using electrons to create X-rays is not efficient because about 99% of the energy is lost as heat. Figure 3 shows a plaque commemorative of Moseley’s research work, erected by the Royal Society on the Clarendon Laboratory at Oxford. The method by which the inner vacancy is created in an orbital's an aspect of X-ray fluorescence spectroscopy that has an extreme importance, e.g. the sample may be bombarded with either high energy X-rays or with high-energy electrons and protons. An incident photon beam experiences a photon absorption interaction with the specimen (i.e. sample taken), while electron and proton beams primarily experience a Coulomb interaction with the specimen (Bounakhla and Tahri, n.d.).
Given the existence of a simple relationship between [math]Z, \lambda[/math], or energy [math]E[/math], of a characteristic X-ray photon, isolation of individual characteristic lines leads to an element distinctive identification. Despite the vast history of this technique, the last 50 years or so have been crucial for its routine application of elemental analysis. Complications associated with experimental procedures and preparations remained for a long time. The broad analytical applications of the method were possible (Muller, 1972) by the progress in the indirect excitation of the spectra by the white radiation of an X-ray tube, and the recording of the spectra by counters. A wide range of process instrumentation has been developed in this expanding field to include probes for analysing millimeter and micrometer-size areas, portable analyzers using radioisotopes to excite X-rays, and ion accelerators for measuring surface concentration and trace elements.
Some of the fundamental laws of physics of interest concerned with X-rays are shown in Table 1.
| TABLE 1. Laws of physics of interest in X-rays (Anzelmo et al., 2013a). | |
|---|---|
| Duane Hunt law, 1915 | [math]\lambda_{min}=12.4/kV[/math] |
| Moseley’s law, 1913 | [math]\frac{c}{\lambda }=a\left ( Z-\sigma \right)^{2}[/math] |
| Bouguer-Lambert-Beer, 1729, 1760, 1852 | [math]I=I_{0}\exp \left ( -\mu \rho \tau \right )[/math] |
| Relationship between atomic number, amperage, and voltage | [math]I=1.4\times 10^{-9}iZV^{2}[/math] |
The modern XRF spectrometers can make use (Jenkins, 200b) of either a single crystal isolating narrow wavelengths thanks to its diffraction power, i.e. wavelength-dispersive spectrometry (WDXRF); or a detector (proportional) isolating narrow energy; i.e. energy-dispersive spectrometry (EDXRF). About 80% of actual spectrometers work in the WD mode with analysing crystals whereas only 20% run in the ED mode, mostly Si(Li) detectors, and lately with Si-drift detectors (Klockenkämper and von Bohlen, 2015). Friedman and Birk first described the prototype of the first commercial WDXRF instrument in 1948. Since then, XRF is one of the most widely applied techniques for quantitative and qualitative elemental analysis. An XRF (small scale) device was sent on the Apollo 15 and 16 NASA missions in the early 1970’s, to study the surface rocks of the moon in situ. This analytical technique is extensively used in industrial quality control due to its character as a fast quasi-nondestructive. High-resolution varieties, e.g. microXRF (μXRF) have been developed recently to achieve (Busch, 2015) extremely fine spatial resolution, being of worth in space exploration (it has been used on Mars), in art conservation (Cotte and Susini, 2011), and other scientific disciplines.
Among the general techniques currently used in X-ray methods are (Palmer, 2011) X-ray powder diffraction (XRD) and WDXRF and EDXRF, and other most sophisticated techniques, e.g. total reflectance XRF (TXRF), proton-induced X-ray emission (PIXE), extended X-ray absorption fine structure (EXAFS), and X-ray absorption near edge fine structure (XANES). Using the EDXRF non-destructive multielement analysis from sodium to uranium at ppm levels may be achieved, whereas application of WDXRF leads to an effective determination of low-Z elements down to even Be (note that not all equipment are able to determine elements with Z<10). Mapping (element distribution images) may be obtained scanning the beam in a television-like raster, and displaying then the intensity of a selected X-ray line (Reed et al., 1995). Electrons collected from the sample produce images revealing surface topography or mean atomic number differences, depending on the selected mode (Tsuji et al., 2015).
TXRF is commonly used for trace and microanalysis, as well as for surface analysis. This technique differs fundamentally (Klockenkämper et al., 1992; Klockenkämper and von Bohlen, 2015) from classical XRF though shows similarities with AAS (atomic absorption spectroscopy) and ICP-AES and ICP-MS (inductively coupled plasma techniques with atomic absorption spectroscopy and mass spectrometry, respectively) used in trace element analysis, and with XPS (X-ray photoelectron spectroscopy, RBS (Rutherford backscattering spectroscopy), and SIMS (secondary ion mass spectrometry) for surface analysis. TXRF uses the principle of total external reflection to restrict the penetration of the primary beam (Klockenkämper et al., 1992; Klockenkämper and von Bohlen, 2015) into the specimen substrate. This technique allows an improvement in the detection limit of the system to the sub ppm/ppb level, thanks to the substantial reduction of scattered background. The formation of standing waves above surfaces and within the near-surface layers is the basis of the total external reflection (Klockenkämper and von Bohlen, 2015, p. 15), which results in a sensitivity surface of a few nanometers.
2 X-rays Production Process
The theory established by Bohr in the early 1900’s is enough to explain the nature of the processes involved in XRF, although quantum theory allows a deeper understanding.
2.1 Atomic Structure: Energy Levels in Atoms
According to the classical (Rutherford-Bohr) model, atoms are composed of a positive nucleus with charged protons and non-charged neutrons, and electrons orbiting around it (Reed, 1995). The number of orbital electrons coincides with the protons of the nucleus (equals to Z) when the atom is in its normal state. At determined distances from the nucleus, the electrons spin in shells, and the valence electrons are located in the outer shell. These shells are known as K, L, M, N, O, P, and Q; the K shell being nearest to the nucleus. Historical connotations are associated with the use of the letters that designate the lower shells (Robinson, 2005); K and L come from the German words Kurz, and Lang, which mean short and long, respectively. The K, L, M, etc. line series nomenclature is due to Barkla, and still is in use today. Each shell represents an energy level, composed of different sub-levels. Electrons take on discrete (quantized) energy. The K shell has the lowest energy and the Q shell the highest. However, note that the most tightly bounded are inner shell electrons, which are those that remove from the atom with more difficulty; i.e. the largest energy difference between any two shells is between the K and L shells; the smallest difference is between the outermost shells. Highest potential energy correlates with lowest binding energy.
The different shells correspond to the different principal quantum numbers of the possible quantum states. The principal quantum number, n, has integral values of 1 (K shell), 2 (L shell), 3 (M shell), etc. The angular quantum number, l, may adopt all values from (n-1) to 0. The magnetic quantum number, m, may adopt values of + l to – l (0 included), i.e. 2 l + 1 values in total. The spin quantum number, s, may adopt two values -½ and +½. The total momentum J of an electron is equal to the vector sum of (l+ s). The Pauli exclusion principle governs the inner shell populations, i.e. one electron is characterized by a unique set of quantum numbers.
The L shell is subdivided into three shells [math](L_{1}, L_{2} \; and \; L_{3})[/math] having a different quantum configuration, but very similar energies (Reed, 1995). The number of sub-shell of shell M is five, and seven is that of N., being K shell unitary. The maximum number of electrons (population) of a shell is given for the number of possible states having a given n, the relevant principal quantum number (Table 2). Thus, shells hold only a certain number of electrons; i.e. the maximum population of electrons to full the K, L, M and N shell, are 2, 8, 18 and 32, respectively.
TABLE 2. Number of shells, subshells and electrons.
| [math]N^{\circ}[/math] shells n | [math]N^{\circ}[/math] subshells 2n-1 | [math]N^{\circ}[/math] electrons 2[math]\mathbf{n^{2}}[/math] |
|---|---|---|
| 1 | 1 | 2 |
| 2 | 3 | 8 |
| 3 | 5 | 18 |
| 4 | 7 | 32 |
2.2 Origin of Characteristics X-rays
Atoms can be excited to generate X-rays by different means:
i) Sample may be directly bombarded with high-energy electrons (direct emission analysis, electron probe microanalysis, and Auger emission spectroscopy).
ii) Sample may be irradiated with high-energy X rays having shorter [math]\lambda[/math] than specimen elements (i.e. X-ray fluorescence analysis).
iii) Sample may be exposed to a radioactive source (Fe[math]_{55}[/math], Cm[math]_{244}[/math], Cd[math]_{109}[/math], Am[math]_{241}[/math], Co[math]_{57}[/math]) having sufficient long periods which generate very high energy X-rays(also called [math]\gamma[/math]- rays) in its decay process. Its intensity is some orders of magnitude inferior to that of X-ray tubes not requiring an elaborate power supply, and allowing portable instruments of reduced dimensions, weight and cost (mobile EDXRF systems) to be used. They are used in field, on line and even extraterrestrial applications (Streli et al., 2017). A permit is usually required for the use of these sources, which entail transport, storage and maintenance problems because they are emitting in a continuous way, unlike other conventional sources.
iv) Synchrotron radioactive source (Robinson, 2005; Sauvage-Simkin, 2011) may be used. However, synchrotron accelerators are accessible at only a few locations around the world (Variankaval, 2005), sharing their service with lots of clientele. The X-ray beam (focused by an optic) can be very small and intensive, affording atomic information on the submicrometer scale. Its intensity is some orders higher (6-12) that from an X-ray tube, and its component is linearly polarized and spread only in the plane (of the orbit) of the synchrotron ring (Dolenko et al., 2017; Janssens, 2004). A high X-ray primary beam intensity combined with a low spectral background can obtain detection limits of down to the ppm level.
v) Alpha particles or other heavy particles bombarding a sample (PIXE); this requiring an appropriate accelerator.
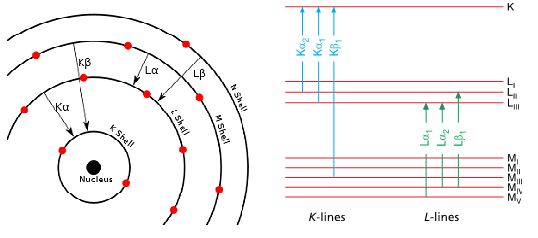
X-ray methods imply exciting an atom by expelling an electron from an inner energy level (Patnaik, 2004), usually from K or L levels (Fig. 4). The [math]\alpha, \: \beta, \: \gamma,[/math] etc. subscripts are used to identify the original electronic level of the electron that occupies the empty space. Thus, a transition of the nearest electronic level is indicated by the letter [math]\alpha[/math], the next one with the [math]\beta[/math], etc. The [math]K\alpha[/math] transitions are approximately six times more likely to occur (thus more intense) than the corresponding [math]K\alpha[/math] transition. Sometimes to identify the particular sub-level or spin state at the main level from which the transition originates, additional numerical subscripts are used ([math]K\alpha_{1},K\beta _{1}[/math], etc.). When an X-ray or a fast-moving electron collides with an atom, the atom may absorb its energy. If the X-ray or electron has sufficient energy, it knocks an electron out of one of the atom’s inner shells (e.g., the K shell), resulting in the removal of this (photo)electron, the atom becoming ionized. The energy of the emitted photon is equal to the differences of energy between the states, initial and final, of the transferred electron. Then, the energy acquired in the excitation process is re-emitted totally or partially, and an electron from a higher-energy shell (e.g., the L-shell) falls almost instantaneously, in 10[math]^{-16}[/math]s, into the position vacated by the dislodged inner electron an X-ray photon being emitted in this process.
The initial vacancy is thus immediately filled by an electron from a higher energy shell, creating a vacancy in that shell that is, in turn, filled by an electron from a yet higher shell. Thus, by a series of transitions, [math]L\rightarrow K,\: M\rightarrow L,\: N\rightarrow M[/math], each new vacancy is filled until the excited atom returns to its ground state. Theoretically this process can go until the outermost orbital is reached. However, in practice it stops rather quickly. The reason for this is that the efficiency of X–ray production is quite low. Only a minor fraction (about 1%) of an electron beam produces X rays. The remaining major percentage of the energy is released as heat, requiring special water-cooling of the target. Quantum mechanical dipole selection rules govern transitions ([math]\Delta n\gt 0,\: \Delta l=\pm 1,\: \Delta J=\pm 1\: or\: 0[/math]) leading to the most intense lines. Some of the transitions are allowed whereas others are forbidden, like in all forms of spectroscopy. Thus, K level vacancies only allows the transitions [math]p\rightarrow s[/math] yielding two lines ([math]L_{2}\rightarrow K[/math] and [math]L_{3}\rightarrow K[/math]) for each main level change (Fig. 5). Similar rules follow L level vacancies yielding to L series lines. The number of lines is now greater because the selection rules allow the transitions [math]p\rightarrow s,\:s\rightarrow p [/math] and [math]d\rightarrow p[/math]. On the basis of the suitable number of transition levels, the transition groups can be easily composed.
2.3 Nomenclature
As we have previously indicated, each electronic transition (apart from radiationless transitions) results in the emission of a characteristic X-ray spectral line whose energy [math]h\nu[/math] is equal to the difference between the binding energies of the two electrons involved in the transition. Every element has its characteristic K, L and M series. Thus, H and He (hydrogen and helium, respectively) do not have XRF spectra since they lack an electron at level L. Light elements from beryllium to fluorine give rise to only a single transition of type [math]K_{\alpha}[/math]. Mid-range elements can emit both K and L series while the heavy elements produce K, L and M series. Thus, the spectra get increasingly complex when we go towards heavier elements. When dealing with heavy atoms, cascade electronic rearrangements are observed, unlike to lighter elements whose electrons are distributed over a smaller number of ground states. In practical XRF, we select the main lines of K and L series to measure an element although there may be other lines present.
The X-ray spectral lines are designated by the symbols such as Ni [math]K_{\alpha _{1}}[/math], Fe [math]K_{\beta _{2}}[/math], Sn [math]L_{\alpha _{2}}[/math], and U [math]L_{\alpha _{1}}[/math]. The symbol of an X-ray line represents the chemical element (Ni, Fe, Sn and U); the notations K, L or M indicate that the lines originate by the initial removal of an electron from the K, L, or M shell, respectively; a given line in the series is designated by the Greek letter [math]\alpha ,\: \beta[/math], etc. (representing the subshell of the outer electron involved in the transition), plus a numerical subscript. This numerical subscript indicates the relative strength of each line in a particular series – for example, [math]K_{\alpha _{1}}[/math] is more intense than [math]K_{\alpha _{2}}[/math].
The use of a Greek letter and numerical subscript to identify an X-ray emission line is traditionally called the Siegbahn notation, developed years ago by Manne Georg Siegbahn, who was awarded the Nobel Prize in Physics in 1924 “for his discoveries and research in the field of X-ray spectroscopy”. His son Kay Siegbahn also later received the Nobel Prize in 1981 for the discovery of X-ray photoelectron spectroscopy.There are several nomenclature systems for atomic shells, depending on the energy levels (K, L[math]_{1}[/math], L[math]_{2}[/math], M[math]_{1}[/math]), electronic configuration (1s, 2p[math]_{3/2}[/math]) or quantum numbers [2, 0, 1⁄2]. Not all X-ray lines have a Siegbahn designation, so the IUPAC established a new identification system for X-ray lines (Jenkins et al., 1991): a line in the spectra is denoted by the element and the shell where the initial hole was; the shell where the electron comes from that fill this hole follows then (Table 3). Although the notation established by IUPAC is much more rational, it is not yet in common use.
Table 3. Correspondence between the Siegbahn and IUPAC notations.
| Siegbahn | IUPAC | Siegbahn | IUPAC |
|---|---|---|---|
| K[math]\alpha_{1}[/math] | K-L[math]_{3}[/math] | L[math]\alpha_{1}[/math] | L[math]_{3}[/math]-M[math]_{5}[/math] |
| K[math]\alpha_{2}[/math] | K-L[math]_{2}[/math] | L[math]\alpha_{2}[/math] | L[math]_{3}[/math]-M[math]_{4}[/math] |
| K[math]\beta_{1}[/math] | K-M[math]_{3}[/math] | L[math]\beta_{1}[/math] | L[math]_{2}[/math]-M[math]_{4}[/math] |
| K[math]\beta_{2}[/math] | K-N[math]_{3}[/math] | L[math]\beta_{2}[/math] | L[math]_{3}[/math]-M[math]_{5}[/math] |
2.4 Absorption and Fluorescence
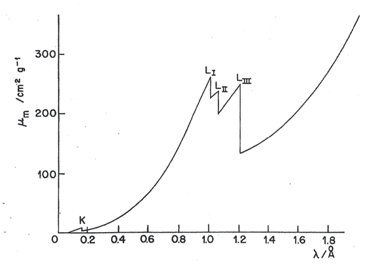
Atoms and molecules can absorb X-rays. The absorption spectrum of an element (like is emission spectrum) is simple, consisting of a few well-defined absorption peaks, the wavelengths of the absorption maxima being characteristics of the element and largely independent of its chemical state. Fig. 6 shows a typical curve of mass absorption coefficient against the X-ray wavelength for tungsten (W); absorption is increasing as wavelength increases. Long wavelengths imply less energy and then less penetrating power, and in consequence, they are absorbed in a more readily way. We may consider the mass absorption coefficient as a measure of the probability of incident radiation to be absorbed, which increases with the wavelength until reaching the absorption limit, where a sudden drop occurs. At certain specific values of wavelengths (energies) that are characteristic of an element, known as wavelength (absorption) edges, there is an abrupt increase (discontinuity) in the mass absorption coefficient (i.e. amount of energy absorbed). This wavelength (energy) corresponds to the ejection of an electron from the element. As the wavelength (absorption) edge is characteristic to the element, the wavelength (absorption) energy can be used with the aim of identifying elements.
The K absorption edge of W occurs at 0.178Å ; X-rays having [math]\lambda \gt [/math] 0.178Å displace K electrons form W atoms, emitting characteristic X-rays in a phenomenon known as X-ray fluorescence, as previously indicated. The energy of X-rays with [math]\lambda \gt [/math] 0.178Å is insufficient to carry out the displacement. Three closely spaced L absorption edges ([math]L_{I},\: L_{II},\: L_{III}[/math]) may also be seen in Fig. 6, marking the wavelength of the incident X-ray beam having (its quanta) sufficient energy to displace L electrons from the atom. The electrons L are more weakly attached to the nucleus and therefore are started at wavelengths longer than the electrons K. In addition, the L-electrons have three slightly different energetic levels giving rise to three close peaks between them. Groups of M and N edges might even appear at longer wavelengths.
The wavelengths of the absorption edges and of the corresponding emission lines do not quite coincide. This is because the energy required to dislodge an electron from an atom (the absorption edge energy) is not quite the same as the energy released when an electron from an outer shell (emitted X-ray energy) replaces the dislodged electron. The amount of energy requited to displace the electron must dislodge it from its orbital and remove it completely from the atom. This is more than the energy released by an electron in an atom that is falling from one energy level to another.
The mass absorption coefficient does not decrease to the zero value after an absorption edge for two reasons: i) there are other electrons that are more weakly bonded and can interact with the X-rays, and ii) in addition to the electron expulsion, dispersion of X-rays by electron contributes to the absorbance. The importance of dispersion increases at low wavelengths ([math]\alpha[/math] decreases) and for low atomic numbers (Z minor). But except when working with light elements (such as carbon, nitrogen, and oxygen), the contribution of dispersion to the total mass absorption coefficient is very little.
Between the limits of absorption, the mass absorption coefficient can be related to the wavelength [math]\lambda[/math] and the atomic number Z by the following approximate empirical equation
[math]\mu \approx \frac{CN}{A}Z^{4}\lambda ^{3}\tag{1}[/math]
where C is a proportionality constant; N is the Avogadro number, and A is the atomic weight of the absorbent element. This equation is more accurate as Z and [math]\lambda[/math] increases (dispersion decreases), assuming that the photoelectric absorption process is the only important variable. Note that as the wavelength increases, the slope between the absorption peaks in a logarithmic representation would reach the value of three, according to Eq. 1.
From an analytical point of view, these principles can be used (Olsen, 1975) in different ways. Three of them can be called X-ray absorptiometry because they are based on Beer’s law of absorption. A fourth method is based on measuring the X-rays of longer wavelengths emitted after irradiating the sample with primary X-rays (fluorescence). All these methods can be explained with reference to the mass absorption curve of the figure.
To irradiate the sample, the following methods may be used:
i) Monochromatic X-rays, preferably of a wavelength such that it corresponds to the short-wavelength zone of an absorption discontinuity. This method is not very specific since most of the elements present absorb in a greater or lesser degree, and the sensitivity is also relatively low;
ii Sequentially monochromatic X-rays of different wavelengths of a range around the absorption limit of the problem element. This absorption limit is located by extrapolation and is used to identify the present element. This is a specific method for a given element, and although relatively insensitive and requires some manipulation of the data to obtain the results, it has been used successfully in routine analyses, especially in the determination of chlorine, sulphur and bromine in hydrocarbons.
iii Polychromatic X-ray bundles. It allows simple and resistant photometers to be used. However, although the sensitivity may be relatively high, the method is very unspecific;
iv The fourth method using these principles for analytical purposes is based on measuring the X-rays emitted by a sample, rather than measuring the absorption of the primary X-rays used. In this case, a primary X-ray polychromatic beam is used to irradiate the sample. Of these, those having a wavelength shorter than the peak to be used produce the photoelectric ejection of an electron from the bombarded atom, the subsequent rearrangement of electrons, and emission by the characteristic secondary (fluorescent) X-ray specimen, which are those which are measured. This method, called X-ray fluorescence spectroscopy, is very specific and can be used in an elemental qualitative analysis. It is quite sensitive although its specificity is its major advantage.
2.5 Continuous Radiation Spectra: Short Wavelength Limit (SWL)
Taking into account the relationship [math]E=h\nu =h\, c/\lambda [/math], connecting the energy E and wavelength [math]\lambda[/math], where h is the Planck constant, [math]\nu[/math] the frequency of the radiation and c the speed of light, either the frequency or the energy may be used to characterize the radiation emitted. The relationship between the energy E and the voltage applied V is given by E = eV, where e is the electron charge. Therefore (Robinson, 2005) when all the energy of the electron is converted to X radiation (instantaneous deceleration to zero kinetic energy in a simple collision), the wavelength of the radiation is a minimum, Duane-Hunt law (and therefore the highest energy)
[math]\lambda _{min}=\frac{hc}{eV}=\frac{\left ( 6.626\, 10^{-34}\, Js \right )\left ( 3.0\, 10^{8}\, m \right )\left ( 10^{10}\, A/M \right )}{\left ( 1.60\, 10^{-19}C \right )V}=12,400/V\tag{2}[/math]
[math]E(keV)=\frac{12.4}{\lambda Å }\tag{3}[/math]
The maximum intensity of the continuous radiation wavelength is approximately 1.5 times the minimum wavelength.
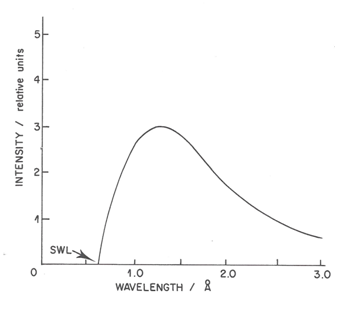
Equation (2) provides a direct means for the highly accurate determination of Planck's constant. The continuous radiation spectrum called “Bremsstrahlung” (Brouwer, 2010) (“Brems“ is German for decelerate; “Strahlung“ for radiation) from a solid metal, therefore, has a well-defined short wavelength limit (SWL). The limit is a function of the accelerating voltage, but not of the solid metal. The same [math]\lambda_{min}[/math] would be obtained by bombardment of lead or tungsten or rhodium at a given accelerating voltage.
The continuous radiation results from the collision of electrons with the atoms of the solid. The electron is losing energy in each collision and decreases its speed producing an X-ray photon, with energy equal to the difference of kinetic energy resulting from the collision. Each electron generally undergoes a series of collisions with each collision resulting in a photon of slightly different energy. The results of these many collisions are the emission of a continuum of X-rays over a wide range. According to classical electromagnetic theory, the process of acceleration of charged particles is accompanied by an emission of radiation, which is a simple explanation of the continuous emission of X-rays.
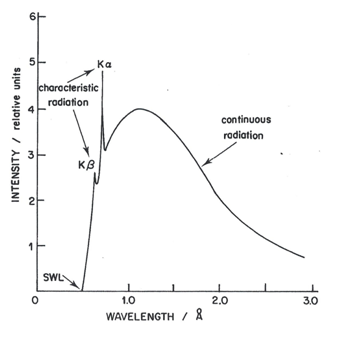
Figure 7 shows the continuous spectrum formed by an X-ray tube containing a molybdenum (Mo) target (anode or anticathode) operating at 20 kV (molybdenum tube). As the accelerating voltage increases above a critical value (characteristic for each element) very narrow emission sharp peaks superimpose on the continuous background. Figure 7 top shows the spectrum produced by the tube operating at 25 kV.The characteristic radiation of the X-ray tube is spread in space isotropically, whereas its continuous radiation has maximal intensity in a plane perpendicular to the trajectory of electrons bombarding the target (Dolenko et al., 2017).
The continuous spectrum is a feature of great utility in an X-ray tube and provides a versatile source of these rays to radiate different elements. The intensity or total power of the emission spectrum of an X-ray tube (integral of the intensity across the spectrum), I, depends on the applied electric power iV in watts, where i is the current in amps and V is the voltage in volts, and of the efficiency in the X-rays production. In practice, the efficiency can only be evaluated empirically, nevertheless, the following equation can be used to estimate the total intensity
[math]I=\left ( 1.4\, 10^{-9} \right )iZV^{2}\tag{4}[/math]
where Z is the atomic number of the bombarded element that is used in the X-ray tube. The equation is not fulfilled by decreasing V, but in any case, it reveals two facts that must be taken into account in the production of X-rays with a bombardment of electrons. It is obvious that this method of production is very inefficient since less than 1% of the energy of the electrons is present in the X-ray beam. The rest of the energy is transformed into heat, so it is necessary to take special precautions to cool the anode whenever necessary. The greater the electrical power applied, the greater the problem of heating.
It is also observed in Eqn. (4) that the intensity depends on the atomic number of the anode used as a target in the cathode ray tube. In fact, in practice, the spectral distribution in the continuum is relatively constant when changing the element (note that the minimum wavelength is independent of Z). However, the absolute intensity is greater for the higher atomic number elements. Tungsten (K[math]\alpha[/math] line at [math]\lambda[/math]= 0.021 nm; E=59 keV) is the element most commonly used in X-ray tubes, because its atomic number is high and its high melting point allows the use of high currents in the tube. If we work at 50 kV with this anticathode, we obtain X-rays that are able to excite the radiation K of all the elements of the periodic table to the cerium (Z = 58). However, the power required from the generator tends to be decreased nowadays, because of the extreme increase in the sensitivity of X-ray detectors. With rhodium as the X-ray tube target we get: K[math]\alpha[/math] line at [math]\lambda[/math]=0.061 nm; E=20.3 keV. Low power (less than 500 mW) miniature X-ray generators have been developed for portable instruments. Laser impact from a pyrolectric (tantalum) crystal yields the electrons required to generate the X-rays in the Cu target material (Rouessac and Rouessac, 2007).
2.6 Characteristic Spectra
The number of lines of an element, observed in practice, depends on a series of factors such as Z, excitation conditions, and range of [math]\lambda[/math] used. Each element has a different arrangement of electrons about its nucleus and thus a different set of energies, then X-rays of characteristic wavelengths and energies that are emitted by each element. The set of lines emitted of each element is contained in its code bar or fingerprint. When the sample consists of many different atoms, each produces a series of wavelengths, all contributing to the total X-ray emission spectrum. Conventional commercial spectrometers cover the K, L and M series, which carry out most of the analytical work. In the higher series, a much larger number of lines are available. The secondary X-ray radiation is much weaker than the primary X-ray beam, and for lighter elements (up to phosphorus, Z=15) is of low E (long [math]\lambda[/math]). So, its power of penetration is low, the beam is drastically attenuated in passing through the air for any distance, and also being absorbed by the detector windows and the sample coating. Consequently, the path of the sample to the detector should keep under a high vacuum (for high throughput analysis). This implies that most of the working parts of the instrument, in practice, must be situated in a large vacuum chamber.
The wavelengths of this emitted X-ray (characteristic lines) and intensities associated depend only on the element being bombarded, because the inner electrons do not take part in bonding. Therefore, the lines are (essentially) independent of oxidation state, bonding, and physical state, making the use of the characteristic lines an elemental analysis technique. Table 4 shows wavelength data for the emission of a few elements. No molecular information is obtained from these lines. Because there are a limited number of possible inner shell transitions, the X-ray spectrum is much simpler than the complex optical spectrum that results from the removal or transition of valence electrons. Furthermore, XRF does not requires destructive dissolution and/or atomization by a flame, arc, spark or plasma, unlike what usually occurs with optical emission (and absorption) methods. Although most of the fluorescence lines observed in the X-ray spectrum are normal, some may appear that do not fit first with the selection rules. No sharp energy distinction between orbitals appear at outer levels, thus arising to forbidden lines. Dual (and multiple) ionization leads to satellite lines. However, both forbidden transitions and satellite lines lack analytical significance, because their intensity is some orders of magnitude inferior to that of the main lines. Nevertheless, they made perturb the interpretation of qualitative spectra and cause some difficulties in trace element analysis. The energy required to extract the K-level electrons from the heaviest elements is too high for the continuous tungsten spectrum source, but this radiation is relatively efficient in the excitation of the L and M spectra of these elements. Tungsten X-ray tubes have been manufactured that can work at 100 kV, allowing K-spectra of heavier elements, up to gold (Z = 79). This fact represents an important advantage, since the K spectra are much simpler and more intense than the L or M. The emission lines of the K series, for example, are about ten times more intense than those of the series L.
In some cases, other factors are important for the choice of cathode ray tube material.For example, if tungsten is to be analyzed by XRF, it is convenient to use a tube with a different element, e.g. molybdenum, as the anticathode, since part of the primary radiation of tungsten can be dispersed by the sample and reach the detector, interfering in the measurement of the fluorescent radiation of tungsten. Another factor to be considered in the choice of the anticathode is its calorific effect, which determines the thickness of the tube window. In general, thin windows with low atomic number anodes can be used, these windows have advantages when using long wavelength X-rays, for example in the analysis of light elements.
The cathode is heated by current flowing through a filament and the high voltage towards the anode accelerates the emitted electrons. The collision of the electrons with the anode produces heat energy and X-rays, a high proportion of which passes through the window. The heat produced, in great quantity, must be dissipated, which is achieved, in general, by circulating water through the anode. However, the power required from the generator tends to be decreased nowadays because of the extreme increase in the sensitivity of X-ray detectors. Modern X-ray tubes have been designated to operate at lower voltages and do not require water cooling of the anode (Robinson, 2005).
TABLE 4. Wavelengths in Angstroms of the more intense lines for some typical elements (Skoog, Holler and Crouch, 2017)
| Element | Atomic Number | K Series
[math]\alpha _{1}[/math] |
K Series
[math]\beta_{1}[/math] |
L Series
[math]\alpha _{1}[/math] |
L Series
[math]\beta_{1}[/math] |
|---|---|---|---|---|---|
| Na | 11 | 11.909 | 11.617 | - | - |
| K | 19 | 3.742 | 3.454 | - | - |
| Cr | 24 | 2.290 | 2.085 | 21.714 | 21.323 |
| Rb | 37 | 0.926 | 0.829 | 7.318 | 7.075 |
| Cs | 55 | 0.401 | 0.355 | 2.892 | 2,683 |
| W | 74 | 0.209 | 0.184 | 1.476 | 1.282 |
| U | 92 | 0.126 | 0.111 | 0.911 | 0.720 |
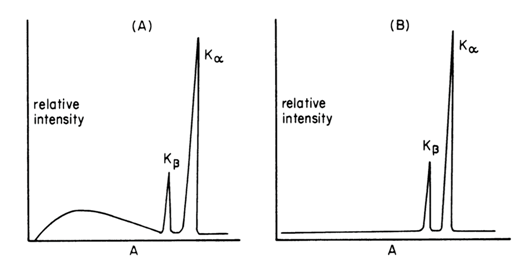
An incident beam of high energy X-rays (the primary beam) may be used to excite the target atoms sufficiently to kick out K electrons. After a short time, the excited ion returns to the ground state, producing a fluorescence spectrum similar to the emission spectrum. However, only the line spectrum appears without the continuous background. Thus, fluorescence spectra show a much greater signal-to-background level and are preferred for analytical work. Thus, in practice, the X-ray spectrum emitted by a given element may consist of a series of characteristic sharp lines (Fig. 8 right) or may be a more complicated spectrum formed by a continuous spectrum of X-rays having very sharp superimposed spectral lines (Fig. 8 left). Whether one or the other spectrum is obtained depends on whether high-energy electrons (Fig. 6 left) or primary X-rays (Fig. 8 right) have been used to bombard the element and expel the internal electron. Of course, the metal used in the target of the first source must have a higher atomic number than chromium to generate fluorescence. The intensity of the secondary source is lower than that a Cr X-ray tube. Loss of intensity, however, is more than offset by the low background from the secondary source in those cases in which monochromatic or nearly monochromatic radiation is required (Robinson, 2014).
2.7 Peaks in the X-rays Spectra
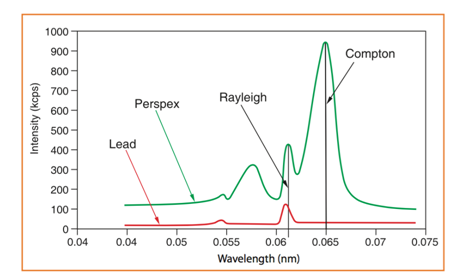
The interpretation of the process has been somewhat simplified, since the atom can lose its excess energy not only by the fluorescence process. When striking a sample with a primary X-ray source, it can be either absorbed or scattered (reflected instead of producing characteristic radiation) through the material. Rayleigh scattering (elastic scattering, without loss of energy) and the Compton effect (release of Compton electrons by inelastic scattering with loss of energy) may also occur (Brouwer, 2010). Samples with light elements (low atomic number specimens) having many loosely bound electrons give rise to the Compton effect and Rayleigh scattering, high and low, respectively. As the atomic number increases (heavier elements) the scatter is reduced, causing the Compton scatter (of greater dispersion and wider spectrum peak) to disappear completely and leave only the Rayleigh scatter. Arthur Holly Compton was awarded the Nobel Prize in Physics in 1927 "for his discovery of the effect that bears his name". Fluorescence and dispersion are dependent on factors such as composition of the material, energy of the X-rays, density and thickness (Bounakhla, nd).
Instead of emitting an X-ray photon, the energy released may knock an electron out of the M shell. This electron is named an Auger electron, and its process formation is the basis of Auger electron spectroscopy (a related method, X-ray photoelectron spectroscopy, is also based on the measurement of the emitted electron). Either X-ray emission or Auger electron ejection occurs for each excited atom, but not both, as they are competitive processes. The number of vacancies in electron levels, which leads to the production of characteristic X-ray photons is, in practice, less than the total number of vacancies created in the excitation process. This is a factor to take into account in determining the absolute number of counts given by an element subject toa set of experimental conditions.
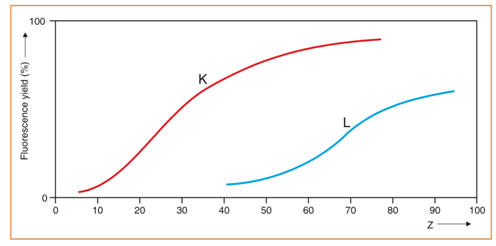
The percentage (fraction) of the excited atoms, emitting X-rays, is named the fluorescent yield (Hubbell et al., 1994; Thomsen, 2007). The fluorescent yield for elements with low atomic numbers is very small and is the reason why the sensitivity of the spectrometric technique is quite poor for elements with very low atomic numbers. If we compare the intensities found for pure barium (Z = 56) and pure aluminum (Z = 13), in equal conditions, the counts given by pure barium are about 50 times higher. The L fluorescent yield is always less than the corresponding K fluorescent yield (Fig. 8) by about a factor of three. No peaks in XRF produce organic elements (i.e. H, C, N, O). Air absorbs low energy X-rays from light elements, as indicated previously, particularly below Ca (Z=20). The detection of light elements requires the use of two different chamber atmospheres a vacuum, for solid and pressed pellets, and helium, for liquid or powdered samples.
Therefore, in addition to elemental peaks (e.g. K & L spectral peaks), we may have other peaks in the spectra: Rayleigh scatter peaks (from target anode in X-ray tube source), Compton scatter peaks (which arise from target element in X ray tube), escape peaks, sum peaks and Bremsstrahlung. Escape peaks are artifact peaks that appear as a consequence of the absorption of some of the energy of a photon by Si atoms in the detector. Prominent at high concentration and lower Z may be reduced by keeping count rates low. When two photons arrive at the same time ([math]K_{\alpha}+K_{\alpha}[/math], [math]K_{\alpha}+K_{\beta}[/math]) gives origin to artefact peaks named sum peaks. Keeping count rates low also reduces this effect. Artifact peaks due to blank media, peaks owing to contaminants in XRF cups, Mylar films, and matrices can also complicate the interpretation of spectra (false positive).
3 XRF Instrument Configurations
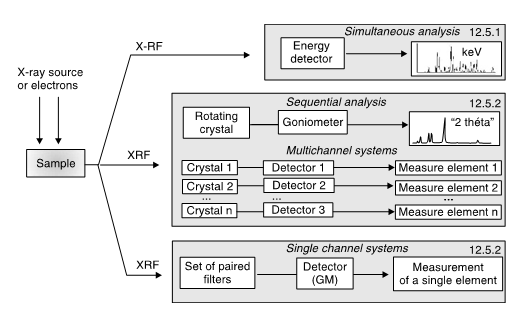
The basic elements of common X-ray spectrometers consist (Anzelmo et al., 2013) in: the primary source unit (where the primary X-ray beam excites the sample), the actual spectrometer itself(where the secondary X-rays emitted are detected),and the electronic measuring device (where the detected radiation is amplified and displayed). These instruments are very sophisticated and somewhat expensive, although the principles on which they are founded are quite simple. The sample might be made the target in an X-ray tube. However, it is more opportune to produce the XRF spectrum from a typical tube (Fig. 12), the most widely used, known as a Coodlige tube, using X-rays of high energy and working under a vacuum ([math]\sim 10^{-4}[/math] Pa, or [math]\sim 10^{-9}[/math] atm). The tube can adopt two geometries: the side window tube and the end window tube (Robinson, 2005; Whiston, 1987). The XRF instruments divide into two main categories (AMC, 1990; AMC, 2006) taking into account the detection system used: wavelength-dispersive (WDXRF), with the use of a monochromator (where the fluorescing radiation is dispersed), and energy-dispersive (EDXRF) detection systems, using a detector capable of determining the energy of counted photons. WDXRF is prevalent among the laboratory spectrometers, and EDXRF in the field of small size portables equipment, with a lower X-ray tube or a radioactive source allowing field measurements.
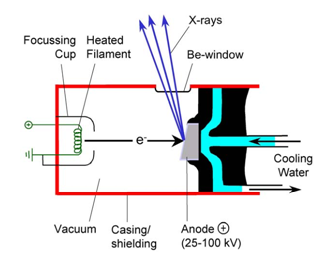
Normal X-ray tubes used in spectrometers employ acceleration voltages in the range of 25-50 kV, and electron currents of the order of 20-50 mA. In the case of the WDXRF, 3 kW tubes are frequently used, while 50-1000 W tubes are used in EDXRF depending on the excitation mode of the sample (Janssens, 2013; Janssens, 2004).The anode of high-power tubes (> 100 W) is usually water-cooled to prevent a meltdown of the metal block, given the low efficacy of conversion of electric power into X-rays, which is about 1 %, the remaining 99 % dissipating as heat.For power levels of the order of 3 kW rotating anode tubes are used, which have the advantage that only the electrons for a short fraction of time bombard a small area of the surface, the rest of time being used in heat removing. It can thus be operated with commercial tubes up to a total power of 18 kW (Janssens, 2013; Janssens, 2004).Note that the process of cooling is not necessary with modern equipment operating at low power (> 50 W), much lower than that of high power tubes ([math]\geq[/math]1 kW). This reduction is possible thanks to the greater sensitivity of X-ray transducers (Skoog et al., 2017). The cheapest and simplest way of obtaining approximately monochromatic X-rays, when it is necessary, is to filter the continuous spectrum from an X-ray tube. When a monochromator is used, cleaner radiation is achieved, but its cost is about 10,000 times more than that of a thin sliver of metal of the correct thickness.
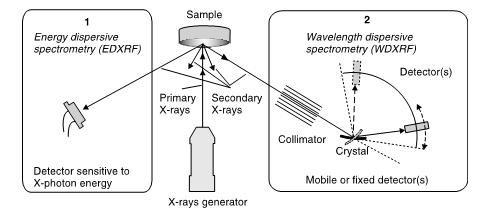
The energy dispersive methodology was carried out with the purpose to acquire the entire XRF spectrum simultaneously, therefore eliminating the condition to obtain data in parcels. EDXRF is the system of choice when looking for multielement information. The EDXRF method instrumentation is simpler, but it does not provide the same degree of wavelength resolution that is shown by WDXRF spectrometers. WDXRF is best suited for fast accurate determination of only a few elements. Despite the operational and implementation differences, both WDXRF and EDXRF instrumentation are based on the same basic principles. In WDXRF (Fig 13 right),a dispersing device separates X-rays of differing wavelength by deflecting them at different angles proportional to their wavelength. As no proper transparent materials are accessible for making lenses, passing through a series of slits or a collection of long narrow tubes collimates the X-rays.As there are no available prisms, the crystals of many salts disperse light and can be used as excellent monochromators. Between the source and the sample we may place a filter, which help to diminish the intensity lines and background, thus improving the S/N (signal to noise) ratio. Tube lines are absorbed whereas lines coming from the sample are not.
In EDXRF (Fig. 13 left), there is no dispersing device, and a detector (e.g. a solid-state detector) measures and records the energies of each individual detected X-ray photon. The primary irradiative intensity constitutes an important difference between the two, and may differ by a factor of 10 or more, which should be considered when dealing with sensitive materials. Table 1 compiles some characteristics of both the WDXRF and EDXRF systems. For EDXR, the elemental range goes from Na (sodium) to U (uranium). The range for WDXRF is wider, from Be (beryllium) to U (uranium). In terms of concentration, the range oscillates between sub-ppm and 100% levels. The high sensitivity of modern spectrophotometers can detect fingerprints, so precautions must be taken in order not to disturb the analysis (Brouwer, 2010). A comparison of the methodologies for XRF measurements is shown in Table 5.
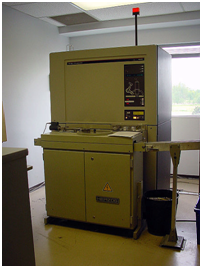
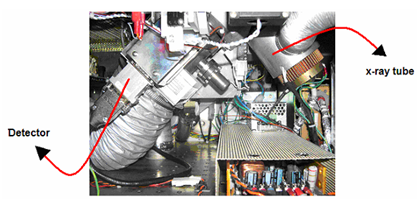
The EDXRF spectrometer system (Fig. 14), first available in the early 1970s, excites a sample using an X-ray tube, generating characteristic radiation for each element in the sample. A portion of that radiation is directed to a detector, giving output pulses proportional in height to the X-ray photon energy, which are used in conjunction with a pulse height analyzer (multichannel type). Solid state Si(Li) or Si drift detectors are usually used, given their superior energy resolution. The ionization occurs in the detector as the X-ray photons strike, amplifying the electric charge then. Both detector and preamplifier are cooled with liquid nitrogen to minimize electronic noise. The detector serves the purpose of determining the energy of each characteristic X-ray generated (qualitative analysis), and simultaneously the number of X-ray photons emitted per second for each energy (quantitative analysis).
A computer (the first analytical instrument to fully use its potential) containing various algorithms converts the intensity found (number of photons per second) for each element to concentration units (Anzelmo et al., 2013). EDXRF provides unique opportunities for rapid qualitative analysis, of great worth in both forensic analysis (Bailey, 2014) and alloy sorting applications. EDXRF systems of small dimensions are equipped with either a small size and lower X-ray tube, or a radioactive source for field measurements.
The WDXRF system, available since the early 1950s, operates in a similar way, except that an analyzing crystal is inserted between the sample and the detector for the purpose of separating (resolving) the different wavelengths (energies), and then directing those wavelengths to the detector. Usual analyser crystals (alphabetically) include ADP (ammonium dihydrogen phosphate), EDDT (ethylene diamine dextrotartrate), Ge, graphite, InSb, LiF, NaCl, PE (tetrakis-(hydroxymethyl)-methane: penta-erytritol), KAP (potassium hydrogen phthalate), RbAP (rubidium hydrogen phthalate) and TlA (thallium(I) hydrogen phthalate). Analyzing crystals such as KAP, RbAP, ADP, EDDT, PET, NaCl etc. are sensitive to humidity. The surface of the crystals deliquesces if exposed to the air, decreasing the intensities of the reflection of the X-rays, damaging the resolution. Because of this reason, the interior of the spectroscopic chamber must be kept in a vacuum, even when the X-ray spectrometer is out of use. Highly acid or alkaline samples, or any samples which sublime at low temperatures, deteriorate the analyzing crystals and led to lower reflection intensities.
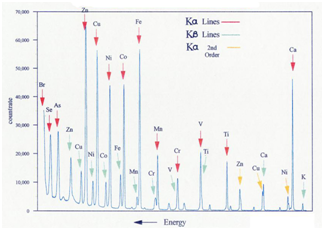
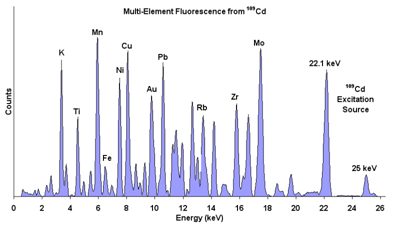
In the detection of lithium (Li) to magnesium (Mg), i.e. in the range of light elements, a additional synthetic multilayer is used. WDXRF instruments are widely used in routineanalysis, production, quality control, and research, when the speed of analysis and analytical precision are mandatory. In these instruments the excitation source is an X-ray tube, available either with one or two scanning goniometers, or with a number of multiple fixed goniometer channels. In the first case, the elemental analysis is carried out sequentially, while in the second elementary simultaneous detection is performed (Fig. 14). In WDXRF, two modes of operation, sequential and simultaneous detection, respectively, are thus possible. In order to record the spectrum, either a linear intensity of a logarithmic scale may be used. In the latter case, very large peaks are not lost, but there is a risk of loss of small peaks.
A very stable high voltage generator plus a sealed X-ray tube with a metallic anode (of Ag, Au, Cr, Mo, Rh or W), called an anticathode, constitutes the primary source of excitation. The generator is able to supply up to about 3 kW of power as a potential of over 60-80 kV (Jenkins, 2000a). WDXRF uses natural crystals and layered synthetic microstructuresas dispersion devices. Detector types range from the gas filled to solid state and even charge-coupled devices (CCD) for XRF. The microprocessors (interface with the human operator) direct and coordinate all of the operations of the spectrometer (Anzelmo, 2013), including capturing the data, processing it, or sending it to a computer for processing, or a network for distribution and storage. An unfiltered beam of primary X-rays irradiates the sample (Janssens, 2013) and a portion of the X-ray fluorescence radiation collimated by the entrance slit of the goniometer is directed onto the surface of the analyzing crystal. The radiation is reflected according to the Bragg equation, passing through the exit collimator to the detector. The diffracted characteristic photons are converted into voltage pulses, which are integrated and finally displayed as a measure of the characteristic line intensity. The major problem related with WDXRF instruments stems from Bragg’s law: it is not possible to measure all wavelengths from a XRF spectrum in a single scan. Therefore, it may be necessary to run multiple spectra when elements in a study differ widely in their atomic numbers.
The low energy X-rays emitted by elements with atomic numbers less than sodium (Z, 11) are easily absorbed by air. Therefore, most X-ray systems operate either under a vacuum or are purged with helium (Robinson, 2005). The entire spectrometer, including the source, sample, optics, and most detectors are within the vacuum/purge chamber. Liquid samples cannot be analyzed under a vacuum, so most systems permit the analyst to switch from a vacuum to a helium purge as needed, usually in less than 2 min.
The great diversity of instruments available (which fit the two main categories previously mentioned) can be classified (Patnaik, 2004) into four basic types: i) simultaneous wavelength-dispersive; ii) sequential wavelength-dispersive; iii) bremsstrahlung source energy-dispersive; iv) secondary target energy-dispersive. Although physically show little physical resemblance, its variation from the analytic point of view lies (Jenkins, 1999) in i) the source used for excitation; ii) the possibility of simultaneous measurement at a given time; (iii) the speed of collecting data; and iv) cost. All the above-mentioned instruments can measure elements of the periodic table from fluoride (Z=9) upwards. They may be equipped with samplers and be automated with the aid of computers, and can reachprecision on the order of a few tenths of one per cent, having sensitivity levels down to the low parts per million.
Recent XRF configurations (AMC, 2008; Bosco, 2013) include handheld spectrometers used for metal sorting and mining prospecting, as well as environmental and toxic metal. The Environmental Protection Agency (EPA, 2007) promoted (Palmer, 2011) in the 1990’s the development of portable XRF analyzers through grants awarded by the "Small Business Innovation Research and Environmental Technology Verification” programs. Thanks to this type of instruments, X-ray spectroscopy has undergone a growth in the field of conservation science during the second half of the 20th century (Sciutto, 2012). It is possible in this way to investigate a theoretically unlimited number of points, obtaining information on the composition and modification of the inorganic components present in a work of art, e.g. pigments, fillers, or degradation products.
TABLE 5.- Comparison of EDXRF and WDXRF Spectrometers (AXT PTY LTD X-Ray Fluorescence - XRF spectrometers; [9]; Beckhoff et al., 2006, pp 301–302; Brouver, 2010, p. 28)
| Aspect | WDXRF | EDXRF | Aspect | WDXRF | EDXRF |
|---|---|---|---|---|---|
| Elemental detection
range |
Be to U | Na to U | Energy resolution | Excellent ~ 20 to 150 eV | Poor ~ 150 eV |
| Spectral resolution | Excellent | Good | Power | Typically < 4 kW | Typically < 1 kW |
| Light element analysis | Excellent | Good | Sample capacity | High | Low |
| Rare earth analysis | Good | Difficult | Automation | Easy | Difficult |
| Detection limit | Optimized for all
elements in the detection range |
Good for light elements but suited, better to heavy elements. | Critical moving parts | Goniometers + Detectors | None to a few |
| Measurement time | Faster | Slower | Cost | Relatively expensive | Relatively inexpensive |
| Sensitivity | Reasonable for light elements,Good for heavy elements | Less optimal for light elements,Good for heavy elements | Measurement | Sequential/ Simultaneous | Simultaneous |
4 Advantages and Disadvantages of XRF
The advantages inherent in XRF are superior (Anzelmo and Lindsay, 1987) to those of any other spectrographic method: (i) X-ray spectra are relatively simple compared to optical spectra, thus minimizing interference of spectral lines; ii) the matrix effect (absorption/enhancement) is predictable and can be easily evaluated; iii) It is versatile, and the determinations are fast and accurate, so it is highly recommended as an analytical technique. Among its limitations we can highlight: i) difficulties encountered in analyzing light elements in liquids; (ii) relatively shallow penetration of solids; iii) it is necessary to have standards with the same physical form as the analyte; iv) the cost of the equipment is high requiring a large initial investment.
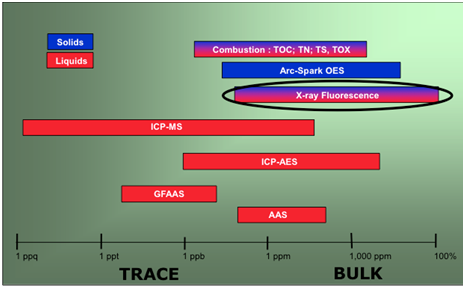
Among the drawbacks we can mention that the analyte may be influenced by the adsorption of the primary radiation and also by the fluorescence radiation produced. This results in a shallow layer of a few tenths of a millimeter deep, providing information on its composition. Conventional XRF in some applications does not rival in concentration range some other emission or absorption atomic techniques, such as ICP-MS (inductively coupled plasma mass spectrometry), ICP-AES (inductively coupled plasma atomic emission spectroscopy), or GFAAS (graphite furnace atomic absorption spectroscopy), as shown in Fig. 19, leading to (Marguí et al., 2007; Marguí et al., 2009) somewhat poorer precision and accuracy.
Sensitivity can be improved by TXRF (Klockenkämper and von Bohlen, 2015; Klockenkämper et al., 1992), where the primary X-ray photons, at very low displacement angles, are absorbed almost completely into thin samples on a very flat support. This avoids the high background radiation produced due to the dispersion of the sample support. Some limitations are also apparent in XRF when dealing with an aqueous sample, e.g. short linear range, the need to strictly match the standards to overcome the effects of the matrix, bubbles released from the solutions owing to an inappropriate filling of the sample holder, and heating of the solution.
5 Sample Handling
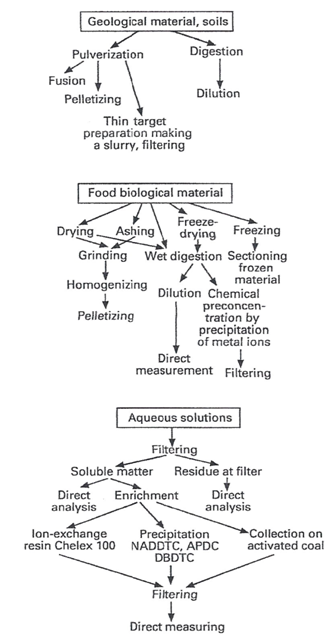
Sample preparation is a crucial step (Yamada, 2014) in the XRF analytical procedure. Figure 20 shows an overview of typical sample preparation techniques (Streli et al., 2017) used in XRF. Among the aims pursued in sample preparationare: i) removal of interference; ii) preconcentration of the analyte; iii) converting the analyte into an appropriate detection form; iv) to provide robust and reproducible methods. Samples have to be representative of the whole sample since spectrometers only analyze the samples surface layer (Brouwer, 2010; van Grieken and Markowicz, 2002; Young et al., 2016). Most spectrometers use circular disks with a radius between 5 and 50 mm to measure the sample placed in a cup (Brouwer, 2010). Special caps with supporting films are used for the measurement of loose powder and liquids (Brouwer, 2010;Campbell et al., 2012; Morikawa, 2014; Moriyama and Morikawa, 2017; Takahashi, 2015). Diluents are sometimes necessary to get sufficient liquid. Liquids cannot be measured in a vacuum because they can evaporate; measuring them in air is possible, although the air absorbs much of the radiation, making it impossible to measure light elements. Therefore, the spectrometer chamber is filled with He gas, so liquids are not evaporated and the radiation is hardly absorbed. In recent years, sample preparation procedure for XRF analysis has undergone an important growth. As a matter of fact, sampling exerts a significant influence on the final quantitative result, being a topic at least as important as the technique itself.
Random (to be minimized) and systematic (that can be removed) errors arise from a variety of sources (Anzelmo, 2014), such as the counting of statistics, the power source, the spectrometer, the macro sampling and specimen preparation processes, calibration standards, correction algorithms, as well as laboratory environment conditions, i.e. temperature, humidity, vibration or dust. Advances in stability of generators, tubes and electronics, the accuracy of goniometers, and the available software to apply empirical and theoretical correction algorithms leave standard selection, sampling and specimen preparation as the largest sources of error.
General rules that lead to the highest accuracy (Anzelmo et al., 2014) include: i) representative sample specimen; ii) homogeneous and flat specimen; iii) similarity between the standards and the unknowns; iv) good reproducibility specimen preparation; and v) specimen stability before and during analysis. The following factors affect the physico-chemical properties of the specimen: i) infinite thickness (i.e., it should not affect the analysis); ii) effective layer thickness (calculated by modern software ad changing with the matrix); iii) surface film absorption characteristics, dealing with liquids samples; iv) particle size effects (loose an pressed powders) such as grain size, intermineral and mineralogical effects, respectively; v) grinding curve analysis (pressed powders); and vi) groove depth, smearing, and groove orientation (metals).
In XRF,the sample preparation procedure has a strong influence on the final quantitative result (Marguí et al., 2016). Standards must be reproducible, having similar physical properties (e.g. comparable mass attenuation coefficient, density, particle size and particle homogeneity, and matrix characteristics as the unknown). The closer the standards are to these requirements, the more accurate the analysis will be. An inadequate choice of a sample from the bulk material (ore deposits, ship cargo holds, quarries, coal seams, rail cars, manufacturing process, and production lines) or an inappropriate sample preparation can lead to introduce large systematic errors in the analytical procedure.
An important factor to take into account also during specimen preparation method (Rouessac and Rouessac, 2007) is the possible re-absorption of the fluorescence emitted by the elements that make up the matrix. Result obtained may thus be underestimated by optical quenching, or overestimated if a secondary excitation of other elements containing in the sample is caused bysome of the X-ray fluorescence. So, sample handling is a crucial step in the ultimate accuracy of any X-ray determination. Based on the handling treatment, we can generally establish (Jenkins, 2000a) three main categories:
- Those that involve a simple pre-treatment, e.g. homogeneous powders, bulk metals (Moriyama and Furusawa, 2016) or liquids.
- Those need significant pre-treatment (e.g. heterogeneous samples, samples requiring matrix dilution or samples with particle size effects).
- Those that entail special handling treatment (e.g. limited size, pre-concentration or prior separation or radioactive samples).
If samples may be properly dissolved, they are best handled as liquids (Marguí, 2014; Moriyama and Morikawa, 2017). The sample handling of liquid samples is very simple, just a small volume of the sample is placed in a type of vial whose bottom is transparent to X-rays (a film of polypropylene or mylar (polyester)). So that the sample appears infinitely thick to the primary X-ray, its depth should be at least 5 mm. In the case of hydrocarbons, the sample depth of absorption can be as much as 1 cm. To dissolve the samples, solvents that do not contain heavy atoms should be used, for example, water and nitric acid are superior to hydrochloric or sulphuric acid. The main technical drawback of liquid samples is the high X-ray scatter background, leading to too low signal-to-noise ratio. To overcome this problem, different extraction techniques (Moradi et al., 2015) have been proposed prior to XRF analysis.
In some cases, solid samples require only a minimum sample preparation, like cleaning and polishing. But, in many other cases, a transformation prior to the measurement is needed (Rouessac and Rouessac, 2007). Heterogeneous bulk solids are generally (Jenkins, 2008) the most difficult kind of sample to handle. Among the most common methods of solid sample preparation are pressed powder pellets and fused glass disks (Takahashi, 2015; Watanabe, 2015; Watanabe, 2016). The first method uses a hydraulic press to pellet formation, being an alternative to the fusion technique. A wax (an organic polymer formed from light elements) is added in order to ensure the cohesion of the pellet. Pressed powder pellets have matrix effects increasing analytical uncertainties, particularly in light elements. In the second method (fusion), a little of the sample is mixed with lithium tetraborate (Li[math]_{2}[/math]B[math]_{4}[/math]O[math]_{7}[/math]) and different additives, obtaining with the aid of an electric oven a glass, named pearl, constituting a matrix of light elements, transparent to X-rays. The use of fused glass method allows the determination of major, minor, and trace elements in a wide range of materials. This method is an advantage in the case of samples that are difficult to dissolve, like refractory samples.
During the melting process (Brouwer, 2010), a part of the sample can evaporate as H[math]_{2}[/math]O or CO[math]_{2}[/math], losing part of its contents. Elements like S, Hg and Cd are prone to escape from the sample during heating, giving what is known as “loss on ignition” (LOI). Total LOI is determined by weighing the sample before and after fusion.It is necessary to know which kind of flux material and how much is required to carry out the analysis in order to make a proper correction. Light elements like Li, commonly used as flux materials (Li[math]_{2}[/math]B[math]_{4}[/math]O[math]_{7}[/math]), cannot be measured.
Granules and powdered materials, oils, bones, and liquors of high salt content are directly analysed under a helium back-flush after pouring in a proper sample cup, if reproducibility is not affected by small variations in packing density. Solid material in liquids or gases must be filtered out and the filter mounted in a suitable holder and analyzed as a solid. There are two kinds of sample holders: cassettes for bulk solid samples, and cells for loose powders, small drilling, and liquids. Polymer films used to cover the cell opening must be low in trace element impurities, strong enough to hold the sample without breaking, thermally stable, and chemically inert (Robinson, 2005). Powders may also be pressed into a wafer, as long as they are previously diluted with a material of low absorption to avoid matrix effects (powdered starch, lithium carbonate, lamp-black, or gum Arabic). Metallurgical samples should be cast in the form of a cylindrical billet (with a ground flat surface for analysis). In order to get the highest precise results, ceramics, refractories, rocks, ores, soils, etc., requires crushing and grinding and prepared in a form reproducible for analysis, i.e., compressed power pellets or glass disks.
Another problem frequently found in bulk materials, large pieces of rock, etc., is their size and heterogeneity (Jenkins 2000a, 2008). Once the sample is received, if it is heterogeneous, it is necessary to render the sample homogeneous prior to the analysis.
As we mentioned above, if the concentration of analyte in liquids or solutions is too high or too low, it is necessary to carry out (Moradi et al., 2015) a step of dilution or preconcentration (e.g., evaporation, solid-phase extraction (SPE), electrodeposition, or classical liquid-liquid extraction, LLE) to bring the analyte concentration within the properly range. Recent analytical techniques used to that end in XRF include (Marguí et al., 2010; Moradi et al., 2015): SPE (disc, quasi-solid, particles, and electrodeposition); or liquid-phase extraction (supported liquid membrane and liquid-phase microextraction).
In SPE the analyte contained in a portion/solution put in contact with a solid-phase sorbent, is adsorbed in a selective way onto the surface of the solid phase. In any other methodology, an elution step is usually required to recover the analyte from the sorbent. XRF implies instead the direct quantification of the element in the solid sorbents. This avoids the use of chemicals and minimizes the sample handling.
Conventional LLE involves large amounts of toxic organic solvents, being also time-consuming, tedious, and a multi-stage operation. It is challenging in recent years to use non-toxic and environmentally friendly analytical procedures (Moradi et al., 2015) consistent with green chemistry postulates. Solvent-free and/or miniaturized extraction methods have been developed in accordance with modern guidelines.
The study of Cultural Heritage (Cechák et al., 2015; Madariaga, 2015; Shackley, 2011; Slanoudis, 2010) is nowadays a very promising field of study. Art objects are often unique and irreplaceable. This implies that a “non-destructiveness” method is a main concern, that is to say “no alteration of the object by the analytical process” (Mantler and Kikovits, 2004). That is the main advantage of XRF over the consumptive spectroscopy methods where sample material is destroyed. Nevertheless, XRF may require sometimes taking a suitable sample from a larger object or some operations like shape, cut, clean, or polish, whereby a valuable piece may be considerably affected or even ruined. In this regard, sample handling is a critical step (Sciutto et al., 2012), due to both the heterogeneity of artwork matrices and the uniqueness and rarity of specimens. Actually, two opposite criteria have to be taken into account: the minimum invasiveness and the maximum representativeness of the system under study. To date, (Madariaga, 2015), XRF is one of the most commonly employed (Brunetti et al., 2016) non-invasive techniques for in situ investigations.
6 Matrix Effects in XRF Analysis
Attenuation and enhancement phenomena affect the intensity of the X-ray line fluorescence spectra of the sample, in what is known as the matrix effect (Janssens, 2013; Jenkins, 2000b; Morgensten et al., 2005; Potts, 2000; Revenko, 2010). As the primary X-rays from the excitation source penetrate the interior of the sample, the phenomenon of attenuation occurs, changing the intensity and spectral distribution of the X-rays available to excite the sample. A matrix effect is also produced as X-rays escape through the sample prior to their detection. Enhancement phenomena are involved in secondary (and tertiary) fluorescence (second element) effects.
In the case of thin samples (collected in filters, mesh or membranes) the matrix effect is often negligible. Matrix interaction arises from the interaction of elements in the sample and its magnitude is function of the elemental composition, affecting the intensity of X-ray emission in a nonlinear way, i.e. the relationships between fluorescence X-ray intensity and analyte concentration is usually non-linear. By using an internal standard technique, we may account for the matrix effect. Thisis perhaps the most practical way (Patnaik, 2004) when the reference and analytical lines are affected by the matrix elements in exactly the same way.
Potential problems (Patnaik, 2004) may appear: i) When the absorption edge of a disturbing element lies between the lines of comparison, a preferential absorption of the line may occur on the short-wavelength side of the edge,
ii) When fluorescence from a matrix line arises between the absorption edges of the analytical and reference elements, the element having absorption edge at the longer wavelength suffer a selective enhancement, iii) When a matrix element first absorbs primary radiation and then emits fluorescence radiation, which is absorbed by a sample element (which fluoresces more strongly), the intensity of the line may be enhanced.
Most of the materials analyzed by XRF are solid samples (of infinite thickness) so that the measurements of fluorescence must apply (Anzelmo, 2014) matrix correction procedures. The use of one or another procedure, for example, fundamental parameter approach, empirical correction models and hybrid correction models and Compton scatter (Potts, 2000; Sitko and Zawisza, 2012), depends on the concrete application and the range of elements to determine. Although the matrix effect may be complex, a plethora of methods to overcome this problem has been devised over the past decades (Rousseau, 2013; Rousseau, 2009; Rousseau, 2006; Sitko, 2009; Sitko 2006a; Sitko 2006b; Sitko and Zawisza, 2012; Smagunova et al., 2012; Willis and Lachance, 2004; Willis and Lachance, 2000). Personal computers (controlling spectrometers) have helped considerably to implement and apply these correction procedures.
A number of various algorithms developed to satisfy specific applications are usually included in commercial XRF analyzers. When analysing alloy, metallic, and rock samples, the fundamental parameters mode (alloy mode) is usually used, whereas in the case of ppm levels of metals in soils and samples of varying density, the Compton normalization mode applies. Thin-film mode (filter and wipe samples) and pass-fail mode (RoHS/WEEE applications) are examples of additional algorithms. RoHS/WEEE are acronyms for “Regulation of Hazardous Substances/Wastes in Electronic and Electrical Equipment”. It is very important to be able to understand the possibilities and limitations of these algorithms in order to get accuracy and reliability (Palmer, 2011) in the qualitative and quantitative analysis. Otherwise, erroneous conclusions (false positive and/or negatives and incorrect concentrations) may be obtained interpreting the true XRF spectra.
7 Quantitation
EDX spectrometers are especially suitable for qualitative work, given the speed of data acquisition with which they are able to measure the entire fluorescence range of X-rays. Equally appropriate are WDX spectrometers, as they are able to observe X-ray fluorescence over a wide range of scattering angles.
Empirical or theoretical methods must be applied to any kind of sample with quantitative analysis purposes. The analyte concentration is related to the fluorescent intensity emitted, which depends not only on the concentration of the analyte itself in the measurement conditions (Markowicz, 2011; Sitko and Zawisza, 2012),but also on a series of factors including matrix (the accompanying elements), physical state of the sample (solid, liquid or powder), method of sample preparation, shape, and thickness.
The intensity [math]I_{i}[/math] is related to the weight fraction of analyte [math]W_{i}[/math], by means of
[math]I_{i}=k_{i}W_{i}+b_{i}\tag{5}[/math]
where [math]k_{i}[/math] (sensitivity) is a constant, whose units are counts per second per unit of concentration, and [math]b_{i}[/math] is the radiation intensity at zero analyte concentration. By applying the least squares method, we may determine [math]k_{i}[/math] and [math]b_{i}[/math] ion the basis of measured reference samples. Eqn. [1] may be rewritten in an inverse calibration way
[math]W_{i}=K_{i}I_{i}+B_{i}\tag{6}[/math]
Equations [5] or [6] requires the careful application of standard samples of similar composition and characteristics like the unknown sample subject of analysis. Measurement conditions (irradiated size, flux, detection system efficiency), sample type, and sample preparation method are all included in the slope [math]K_{i}[/math], and they are not taken into account in further calculations. Nevertheless, the rule in XRF analysis is not a simple linear calibration. Using standards with a very limited concentration range gives rise to a high uncertainty in the ordinate at the intercept and slope. Due to the matrix effect, instead of Eqn. [6] we get
[math]W_{i}=K_{i}I_{i}M_{i}+B_{i}\tag{7}[/math]
where [math]M_{i}[/math] is the total matrix effect term. Its value is [math]M_{i}\gt 1[/math] if the matrix absorbs analyte radiation or absorption effects outweigh those of enhancement. Otherwise [math]M_{i}\lt1[/math].The relative radiation intensity [math]R_{i}[/math] usually replaces to the radiation intensity [math]I_{i}[/math] in matrix correction methods.
The numerous methods proposed for quantitative XRF analysis, theoretical and empirical, are shown schematically in Fig. 21, where the compensation and matrix correction methods, respectively, are the two main groups. Theoretical models (fundamental parameters, theoretical influence coefficients) are now easily applied (Rousseau, 2013; Sitko, 2009; Sitko, 2006; Sitko and Zawisza, 2012; Smagunova et al., 2012; Willis and Lachance, 2004) in routine analysis thanks to the advances in computers. Various influence coefficient algorithms help to correct matrix effects and are schematized in Fig. 22. They differ in i) how the influence coefficients are calculated, i.e., in a theoretical or empirical way; ii) what variables apply in the term of matrix correction (either concentration or intensity); iii) the milieu in which the coefficients (constant or variable, binary or multielement) are determined. Influence coefficient algorithms scheme is shown in Fig. 23. Details concerning the various aspects of Fig 21 to 23 are beyond the scope of this general chapter and should be consulted in Sitko and Zawisza (2012).
Validation methods, comparison methods, and interlaboratory studies are important topics to deal with in quality control. However, the number of papers devoted to these subjects in XRF analysis is relatively scarce. Table 6 covers the main contributions in the field, which also includes specific papers concerning the XRF uncertainty measurements and detection limits, the latter case containing mainly modern references.
8 Developments and Challenges
Developments in the instrumental aspects of the X-ray spectrometry have been significant in recent decades (Bush, 2015; Chen et al., 2014; Marguí and van Grieken, 2013a; Marguí and van Grieken, 2013b; Revenko, 2012; Revenko, 2011; Revenko, 2000; Tsuji et al., 2004). Advances in signal processing and X-ray production, and novel detection facilities afford an increase in sensitivity and precision. Likewise, the development and commercialization of benchtop spectrometers, allow an easy operation at low-cost, encouraging the application in (problem-solving) industrial routine analysis of XRF techniques.
One of the hot topics nowadays in science and technology is miniaturization, a permanent challenge of analytical chemistry both in the field of instrumentation and in sample treatment procedures. As a matter of fact, the μ-TAS (micro-total analysis system, lab-on-a-chip or microfluidic analytical system) has been an authentic revolution (Marguí et al., 2013a) facilitating automation (a very important aspect in a routine analysis), while reducing the consumption of reagents or expensive samples at the nanoliter level. Mixing, chemical reactions, and separations are carried out inside microchannels or microchips whose dimensions are of the order of several tens of mm[math]^{2}[/math]. In the fields of medical (Mattssons and Börjesson, 2008; Börjesson, 2003) and environmental monitoring, the small size of the chemical microchip is a great advantage. Varying miniaturized chip systems devices found uses in preliminary preconcentration steps previous to XRF analysis.
The possibility of using smaller spots and thinner substrates in the dried spot technology (Marguí, 2010) is also an important subject in miniaturization. Vibration, extrusion, and solvent elimination have been recently applied to generate picoliter- and femptoliter-sized droplets. In the characterization of specimens in the field of Cultural Heritage, miniaturization of the instrumentation is of great worth in easily performing “in situ” studies. X-ray microtubes are being devised which, in combination with poly-capillary lenses, may focus the primary beam to less than 100 μm. This, together with the development of highly sensitive detectors for the secondary X-ray radiation, is a further step to satisfy the requirements for non-destructive analysis of art objects.
Future advances in the instrumental aspects of XRF as well as in preconcentration procedures will soon make possible to find new ways of determining trace elements in liquid samples. It is well known that in the pathogenesis of many disorders, trace elements play a vital role. In dealing with selected diseases, the topographic and quantitative elemental analysis of pathologically modified tissues may provide some light on the processes giving rise to the degeneration of cells. In this context, SM-XRF (Synchroton Microbeam X-Ray Fluorescence) is a powerful tool allowing the carrying out of research of the elemental composition of tissues at the simple cell level.
The most important recent developments of and current challenges of XRF fluorescence spectrometry are summarized in Tables 7 and 8, respectively.
TABLE 6. Selected XRF papers about validation/method comparison, inter-laboratory studies and detection limit.
| Content | Reference |
|---|---|
| Validation/Method Comparison | |
| Development and validation of an EDXRF method for the fast quantification of mineral elements in dry pet food samples. | Perring et al., 2017 |
| NIR and XRF spectroscopy were investigated to predict the concentration of calcium, potassium, iron, magnesium, manganese and zinc in artichoke samples. | Mir-Marqués et al., 2016 |
| Validation of XRF spectrometry for determining osseous or dental origin of unknown material | Christensen et al., 2012 |
| Comparison of methodologies of gamma ray spectrometer and XRF in the determination of thorium concentration in monazite bearing sand samples. | O'Cunha and Narayana, 2012 |
| A simple and quick method for the quantification of macroelement and trace elements by WDXRF. Validation and comparison with ICP-AES and potentiometry reference methods. | Perring and Blanc, 2008 |
| The capabilities of test procedures toward the validation of XRF analysis with environmental concern. The applied analytical scheme was based on the combination of fusion and pelletizing technique for sample preparation, while matrix correction was performed by means of the fundamental parameter and the scattered radiation method. | Morgenstern et al., 2004 |
| Comparison of the results obtained with XRF spectrometry (quantitative and semiquantitative method measurements) for iron ore samples in terms of precision and accuracy of results, sample preparation and availability of standards. | Pereira and Brandao, 2001 |
| Validation of XRF measured swine femur lead against atomic absorption spectrometry. | Todd et al., 2001 |
| Validation of K XRF bone lead measurements by inductively coupled plasma mass spectrometry in cadaver legs. Levels in the bare bones were again measured by KXRF. | Aro et al., 2000 |
| Validation of a method for the determination of boron in ceramic materials by XRF spectrometry. | Sanchez-Ramos et al., 2000 |
| Inter-laboratory studies | |
| Performance criteria for an ASTM XRF standard test method for chemical analysis of hydraulic cements: Inter-laboratory study using two cements, and the two sample preparation methods were divided among the laboratories. | Stuzman and Heckert, 2013 |
| An interlaboratory comparison of bone lead measurements via K-shell XRF spectrometry: validation against inductively coupled plasma mass spectrometry. | Bellis et al., 2012 |
| An evaluation of inter-laboratory reproducibility for quantitative XRF of historic copper alloys. Fourteen institutions, primarily from the museum community, participated in the study, using a total of 19 XRF instruments. | Heginbotham et al., 2010 |
| Chemical analyses of basaltic rocks: Comparisons of shipboard XRF data with results from four laboratories, involving shore-based XRF studies, studies using sequentially reading ICP-AES instruments, and studies using multichannel ICP-AES instruments. | Boström and Bach, 1995 |
| Uncertainty | |
| Evaluation of uncertainty in the energy dispersive XRF determination of platinum in alumina. | Devi et al., 2015 |
| Statistical and mathematical concepts and principles applicable to uncertainty calculations for the measurement of in vivo bone lead by 109Cd K XRF. | de Brito, 2012 |
| Uncertainty measurement evaluation of WDXRF and EDXRF techniques for the Si and Utotal determination in U3Si2 nuclear fuel. | Scapin et al., 2011 |
| Uncertainty calculations for the measurement of in vivo bone lead by XRF. | O´Meara and Fleming, 2009 |
| Effect of the sample matrix on measurement uncertainty in XRF analysis. | Morgenstern et al., 2005 |
| Mathematical techniques for propagation of uncertainties in XRF analysis. Correction for calculating estimates of lead concentration and uncertainty for in vivo XRF bone analysis with Cd-109 source. | Kondrashov and Rothenberg, 2001 |
| Detection limit | |
| Experimental dependence of the relative standard deviation on analyte concentration of hyperbolic type, characterizing the precision of quantitative chemical analysis to estimate the limits of detection and determination in the XRF analysis. | Borkhodoev, 2016 |
| About a correlation between the limits of detection and determination in XRF analysis. Different approaches to determine it. | Borkhodoev, 2015 |
| The use of real samples with low analyte concentrations as blank samples: A criterion for the assessment of the correctness of different equations for calculating the limit of detection. | Borkhodoev, 2014 |
| The basic philosophy behind the interpretation of the concept of the limit of detection and a new realistic and representative way to name it is proposed. The distinction between the limit of detection and the limit of determination is clearly established. | Rousseau, 2001 |
TABLE 7. Most important XRF recent developments (Bush, 2015).
| Microfocusing tubes and (multielement) silicon drift detectors |
| Electronics using field-programmable gate arrays (FPGA) for dynamic filtering (count rates well above 1 MHz per detector channel with good energy resolution) |
| X-ray optics (polycapillary and doubly curved crystals) available for both laboratory and synchrotron instrumentation |
| Highly specialized optics for synchrotron enabling spatial resolution in the nanometer scale (sub-micrometer spatial resolution) |
| Handheld XRF spectrometers (XRF kits connectable to a USP computer port, with sensitivity analogous to a kilowatt water cooled X-ray tube of XRF instruments) |
| Low-power instrument advances in total reflexion XRF, polarization XRF, and [math]\mu[/math]XRF |
| Both small-scale (battery-driven XRF; NASA spectrometer using on Mars) and large-scale (new synchrotrons and X-ray free electron lasers) |
TABLE 8. Current XRF challenges (Bush, 2015).
| Quantification at the microscale (need for robust, high accuracy, and easy-to use software for quantitative analysis) |
| Calibration in image approaches and accurate in situ trace elemental determinations |
| Improving detection limits for most elements, especially for trace environmental analysis (MXRF though helps in this sense proves only in a small surface, and TXRF is limited to highly reflective surface) |
| Advances in synchrotrons in the laboratory (sub-micrometer elemental images on biological specimens discerning elemental composition and spatial distribution |
| Avoiding problems caused by non-homogeneous, small area analysis, and imaging will be of great worth |
| Sorting-out dependent XRF (with some newly developed light sources) |
| Guidance on the best practices with the aid of instrument interfaces or expert systems (advances in software) |
| Availability of inexpensive portable and bench top XRF instruments has led to an increase in their use in undergraduate programs |
| Push-button black-box for many applications |
9 Applications
XRF spectroscopy, as a fast and quasi-non-destructive analytical technique, finds a wide application in industry, e.g. in quality control (Shimadzu, 2016), in environmental chemistry (Scharnweber et al., 2016), food science (Ali et al., 2014; Chen and Palmer, 2013; Fernandes et al., 2015; Pytlakowska, 2016), life sciences (Sayerx et al., 2017), medical diagnostics (Wanzilak et al., 2015), toxicology (Guerra et al., 2016; Mbaye et al., 2015), and art paintings (Sepulveda et al., 2015). Table 9 includes some ISO approved XRF analysis methods of great industrial worth, whereas a number of varying applications are compiled in Table 9 and are classified by fields. MicroXRF (μXRF),a high-resolution version of the same method, achieves an extremely fine spatial resolution, being of great worth in many research fields (Bush, 2015), e.g. art conservation (Manso et al., 2017) and space exploration (Young et al., 2016).
Geoscientists for rock, mineral, and soil analysis use XRF (Berger et al., 2014; Hafez et al., 2017; Rowe et al., 2012; Traore et al, 2015; Young et al., 2016). Some health professionals also employ the technique for environmental screening purposes (Palmer, 2011). The FDA (Food and Drug Administration) recommends XRF devices for varying regulatory applications (Palmer, 2009) concerning toxic elements in food, fish and consumer products.Museum scientists also utilize XRF as a routine tool (Adriaens, 2005; Ferretti, 2012; Mantler and Klikovits, 2005; Navas et al., 2016) for the authentication of artifacts, e.g. determination of the composition of paints, jewelry, and coins. The identification of toxic elements, e.g. As and Hg in natural history collections, may also be carried out. The chemometric methods are increasingly used in the treatment of data obtained by XRF for classification purposes, which gives an idea of the sophistication of some users (Gajic-Kvascev et al., 2012; Mbaye et al., 2015; Sciutto et al., 2012; Traore et al., 2014; Wandzilak et al., 2015). XRF has found wide use in forensic investigations (Bailey, 2014).
Boron compounds have a vital role (Sanchez-Ramos, 2000) in the ceramic industry (and other related ones) as components of raw and more complex ceramic materials, respectively, imparting to ceramic pastes certain desirable properties (plasticity, lower fusion temperature). They find great application in the making of glaze ceramic tiles, artistic bodies and ceramic enamels (ceramic frits materials of a vitreous nature). Boron determination is difficult and is a basic task to carry out in specialized (ceramic) laboratories. XRF is the technique which is most used and most efficient for this task. It allows determining qualitatively and quantitatively practically all the elements present in any kind of ceramic materials.
TABLE 9. ISO (International Organization for Standardization) XRF approved methods.
| Sample | Norm |
|---|---|
| Iron ores (various elements, precision) | ISO 9516-1: 2003; ISO/WD 9516-2: 2016; ISO/CD TR 16859:2017; ISO/TR 18231: 2016; ISO 16043: 2015 |
| Soil quality (elemental composition) | ISO 18217:2014; ISO/TC 190/SC 3N: 2012; ISO 13196: 2013 |
| Surface chemical analysis (total reflexion of water, biological and environmental analysis) | ISO 17331: 2004; ISO/DIS 20289; ISO/TC 18507: 2015; ISO 14706: 2014 |
| Refractory products (fused cast-bead method | BS EN ISO 12677: 2011 |
| Solid biofuel (elemental composition) | ISO/TS 16996: 2015 |
| Petroleum products (sulphur content) | ISO 20847: 2004; ISO 20884: 2011 |
| High alloy steel (analysis) | ISO 17054:2010 |
| Cement (chemical analysis) | ISO/TR 12389: 2009; ISO 29581-2: 2010 |
| Hard metals (metallic elements, fusion) | ISO 4503: 1978 |
Finally, the fact that analyses need to be done in a non-destructive and even more so in a non-invasive way (Adriaens, 2005; Mantler and Klikovits, 2004; Sciutto et al., 2012; Slanoudis et al., 2010) is very important in many cases, as removing samples may be unacceptable.
XRF analysis is normally performed in an analytical laboratory environment. Portable XRF equipment have recently been used as a potential screening tool in crime scenes (Christensen, 2012). However, portable instruments are usually not able to detect light elements, e.g. phosphorus osseous and dental tissue. Research is needed in this context to build portable instruments able to eliminate air, and including a suitable X-ray source. No sample preparation is needed for effective XRF analysis in most cases. However, significant surface contamination, mainly in ancient samples, may adversely affect the results of an analysis. It either requires a cleaning surface (free from possible contaminants) or removing the outermost layer previous to perform the analysis. Table 11 shows a number of recent XRF applications summarized with some detail.
TABLE 10. Selected applications of XRF analysis.
| Field | Application |
|---|---|
| Industry | Elemental analysis,
Quality control (metals in pharmaceutical industry; lead in gasoline; metals in vegetal material; analysis of falsified products; power products in ferrous-metallurgy) |
| Geosciences | Geological materials and planetary surface exploration,
Rocks, mineral and soil analysis |
| Food Science | Toxic elements in consumer products,
Calcium in powdered milk |
| Forensic investigations | Detection of body fluids and gun-shot residues at crime scenes,
Detection of the potential skeletal origin of unknown material in forensic anthropologic studies, Elemental analysis of questioned materials, Separating osseous and dental material from other materials at forensic scene, especially fires |
| Archaeological studies | Chemical analysis of bone and other tissues for the diet determination |
| Medical | Detection of lead, zinc, arsenic, and other toxic elements,
Stable iodine in the thyroid-gland, Dental and medical specimens |
| Ceramic and other
related industries |
Determination of boron with satisfactory accuracy in ceramic materials (raw materials and frits or glasses of complex and variable composition) |
| Environmental research | Screening of contaminated sediments and soils to investigate anthropogenic impacts,
Insight in both the source of environmental pollution and the distribution of analytes in contaminated areas, Examination and optimization of remediation processes, Lead, cadmium and mercury in occupational and environmental studies |
| Cultural Heritage field | Inorganic pigments on painted objects,
Museum objects, Titanium elemental mapping of white spots on paintings to date or authenticate the painting, Iron gall inks, pencils and coloured crayons, Cultural relics and archaeological finds, Numismatic studies, Glass materials |
TABLE 11. Specific applications of XRF analysis in archaeological, environmental, food sciences, geosciences, medical and pharmaceutical studies.
| Content | Reference |
|---|---|
| Analytical investigation of Mudéjar polychrome on the carpentry in the Casa de Pilatos palace in Seville using non-destructive XRF and complementary techniques. | Garrote et al., 2017 |
| Geochemical survey of soil samples from the archaeological site Dromolaxia-Vyzakia (Cyprus), by means of micro-XRF and statistical approaches. | Hafez et al., 2017 |
| Unveiling the Third Secret of Fátima: l-XRF quantitative characterization and 2D elemental mapping. A set of five manuscripts written by Sister Lúcia between 1941 and 1944 were under study. | Manso et al., 2017 |
| Feasibility of WDXRF spectrometry for the determination of metal impurities in pharmaceutical products and dietary supplements in view of regulatory guidelines. | Figuereido et al., 2016 |
| A commercial benchtop EDXRF setup to perform elemental mappings and quantitative evaluation of the migration of toxic elements from the amalgam to the tooth. | Guerra et al., 2016 |
| A combination of dispersive micro solid-phase extraction, based on graphene as a solid sorbent, with EDXRF is proposed for preconcentration and determination of Co(II), Ni(II), and Cu(II) ions in wine samples. | |
| Pytlakowska, 2016 | |
| Degree of synchronism of elemental time series within and between trees of one coniferous (Pinussylvestris L.) and one broadleaf (Castanea sativa Mill.) species growing in conventionally managed forests without direct pollution sources in their surroundings. μXRF analysis was used to establish time series of relative concentrations of multiple elements for different stem heights and stem exposures. | Scharnweber et al., 2016 |
| WDXRF for the quantitation of metallic micronutrients in fortified milk powders intended for infant’s consumption: monitoring and comparison of the values obtained with the corresponding values labeled by manufacturers and those described in the Portuguese and European legislations. | Fernandes et al., 2015 |
| Multivariate statistical techniques to determine essential and toxic elements in biological samples by XRF. | Mbaye et al., 2015 |
| Results of exploratory in situ analyses with a portable XRF applied to six rock painting sites, located from Lluta to Camarones coastal valleys in the Atacama Desert, northern Chile. | Sepúlveda et al., 2015 |
| XRF study of the concentration of selected trace and minor elements in human brain tumours. | Wandzilak et al., 2015 |
| An EDXRF method using X-ray emitting isotopes in combination with pre-concentration by carbonization was developed to determine the levels of Mo and Pb accumulated in foods. | Ali et al., 2014. |
| MSL-APXS titanium observation tray measurements: Laboratory experiments and results for the Rocknest fines at the Curiosity field site in Gale Crater, Mars. | Berger et al., 2014 |
| XRF combined with chemometrics for the characterization of geological samples: A case study in Southeastern Senegal. | Traore et al., 2014 |
| A handheld EDXRF analyzer to determine calcium in powdered milk. Quantification was performed using two different methods (external standards and the method of standard additions) to illustrate a matrix effect as well as a means for compensating for it. | Chan and Palmer, 2013 |
| Portable EDXRF spectrometry analysis for the characterisation of archaeological ceramic findings from three Neolithic sites in Serbia. Two dimension reduction techniques, principal component analysis and scattering matrices-based dimension reduction were used to examine the possible classification of those findings, and to extract the most discriminant features. | Gajić-Kvaščev et al., 2012 |
| A comparison of handheld EDXRF and WDXRF results from pressed powder pellets of Mississippian-age Barnett Shale of North-Central Texas, USA. Evaluation of the reliability of the reference calibration and the quantification of unknown samples using two different instrument platforms. | Rowe et al., 2012 |
| An advanced multivariate approach for processing XRF spectral and hyperspectral data from non-invasive in situ analyses on painted surfaces. | Sciutto et al., 2012 |
10 Radiation Safety
Common X-ray tubes used for medical or dental purposes have a power several orders of magnitude greater than conventional XRF analyzer equipment. Time, distance, and shielding are the three basic principles of radiation protection (Palmer, 2011; Whiston, 1987). The amount of time spent in the vicinity of the radiation source should be kept to a minimum. The increase in distance from the radiation flux and the increase in shielding both decreases the amount of radiation exposure. The conception of ALARA (keeping radiation exposure "as low as reasonably achievable") should prevail.
Most XRF analyzers include(Palmer, 2011) a “fail-safe” feature that turns off the X-ray source if the beam does not detect the sample. The sample or the air absorb most of the X-rays in the analyzing process. Air attenuates any escape of X-rays, their intensity exponentially falling as a distance from the source increases. In the case of XRF portable analyzers, if they are properly used, radiation exposure is not detectable above background levels.
11 References
Adriaens, Annemie. “Non-Destructive Analysis and Testing of Museum Objects: An Overview of 5 Years of Research.” Spectrochimica Acta - Part B Atomic Spectroscopy 60 no. 12 (2005): 1503–1516.doi:10.1016/j.sab.2005.10.006.
Ali, Muhammad, Choudhury, Tasrina Rabia, Hossain, Babul, Ali, Md Panna. “Determination of traces of molybdenum and lead in foods by x-ray fluorescence spectrometry.” SpringerPlus 3 (2014): 341. doi:10.1186/2193-1801-3-341.
Analytical Methods Committee, AMC. “Evaluation of analytical instrumentation. Part VI Wavelength dispersive X-ray spectrometers.” Analytical Proceedings 27 no. 12 (1990): 324-333: doi:10.1039/AP9902700324.
Analytical Methods Committee, AMC. “Evaluation of analytical instrumentation. Part XX Instrumentation for energy dispersive X-ray fluorescence spectrometry.” Accreditation and Quality Assurance 11 no. 12 (2006): 610-624. doi:10.1007/s00769-006-0187-8.
Analytical Methods Committee, AMC. “Evaluation of analytical instrumentation. Part XXIII Instrumentation for portable X-Ray fluorescence spectrometry.” Accreditation and Quality Assurance 13 no. 8 (2008): 453-464. doi:10.1007/s00769-008-0358-x.
Anonimous. “X-Ray Fluorescence (XRF): Understanding Charateristics X-Rays.” TUT-XRF-003, https://amptek.com/.
Anzelmo, John A., and Lindsay, James R. “X-ray Fluorescence Spectrometric Analysis of Geologic Materials. Part 1. Principles and Instrumentation.” Journal of Chemical Education 64 no. 7 (1987): A181-A185. doi:10.1021/ed064pA181.
Anzelmo, John A., Bouchard, Mathieu, and Provencher, Marie-Ève. “X-ray Fluorescence Spectroscopy, Part I: The Educational Essentials.” Spectroscopy 28 no. 7 (2013): 1-6. http://www.spectroscopyonline.com/. Anzelmo, John A., Bouchard, Mathieu, and Provencher, Marie-Ève. “X-ray Fluorescence Spectroscopy, Part II: Sample Preparation.” Spectroscopy 29 no. 7 (2014): 1-10. http:// www.spectroscopyonline.com/.
Aro, Antonio, Amarasiriwardena, Chitra, Lee, Mei-Ling, Kim, Rokho, and Hu, Howard. “Validation of k x-ray fluorescence bone lead measurements by inductively coupled plasma mass spectrometry in cadaver legs.” Medical Physics 27 no. 1 (2000): 119-123. doi:10.1118/1.598863.
Assmus, Alexi. “Early history of X Rays.” Beam Line Summer (1995): 10-24. http://www.slac.stanford.edu/.
Bailey, Melanie J. “X-ray Spectrometry in Forensic Science.” X-Ray Spectrometry 43 no. 1 (2014): 1-66. doi:10.1002/xrs.2506.
Beckhoff, Burkhard, Kanngießer, Birgit, Langhoff, Norbert, Wedell, Reiner, and Wolff, Helmut. Handbook of Practical X-Ray Fluorescence Analysis. Berlin Heidelberg: Springer-Verlag, 2006.
Bellis, David J., Todd, Andrew C., and Parsons, Patrik J. “An interlaboratory comparison of bone lead measurements via K-shell X-ray fluorescence spectrometry: validation against inductive coupled plasma mass spectrometry.” Journal of Analytical Atomic Spectrometry27 (2012): 595-603. doi:10.1039/C2JA10369A.
Berger, Jeft A., King, Penelope L., Gellert, Ralf, Campbell, L., Boyd, Nicholas I., Pradler, Irina, Perrett, Glynis A., Edgett, Kenneth S., VanBommel, Scott J. V., Schmidt, Mariek E., and Lee, Rebekka E. H. “MSL-APXS titanium observation tray measurements: Laboratory experiments and results for the Rocknest fines at the Curiosity field site in Gale Crater, Mars.” Journal of Geophysical Research: Planets 119 (2014): 1046-1060. doi:10.1002/2013JE004519.
Börjesson, Jimmy, Isaksson, Mats, and Mattsson, Sören.“X-ray fluorescence analysis in medical sciences: a review.” Acta Diabetologica 40 (2003): S39-S44. doi:10.1007/s00592-003-0024-z. Borkhodoev, V. Ya. “About a Correlation between the Limits of Detection and Determination in X Ray Fluorescence Analysis.” Journal of Analytical Chemistry 70 no. 11 (2015): 1307-1312. doi:10.1134/S106193481509004X.
Borkhodoev, V. Ya. “About the Limit of Detection in X Ray Fluorescence Analysis.” Journal of Analytical Chemistry 69 no. 11 (2014): 1041-1046. doi:10.1134/S1061934814110021.
Borkhodoev, V. Ya. “Estimation of Limits of Detection and Determination in X-Ray Fluorescence Analysis by the Dependence of the Relative Standard Deviation on Analyte Concentration.” Journal of Analytical Chemistry 71 no. 9 (2016): 910-915. doi:10.1134/ S1061934816070054.
Bosco, Gerra L. “Development and application of portable, hand-held X-ray fluorescence spectrometers.” Trends in Analytical Chemistry 45 (2013): 121-134.doi:10.1016/ j.trac.2013.01.006.
Boström, Kurt, and Bach, Wolfgang. “Data report: chemical analyses of basaltic rocks: an interlaboratory comparison.” Proceedings of the Ocean Drilling Program, scientific results; East Pacific Rise; covering Leg 142 of the cruises of the Drilling Vessel JOIDES Resolution, Valparaiso, Chile, to Honolulu, Hawaii, Site 864, 12 January-18 March 1992. 142 (1995): 75-81. doi:10.2973/odp.proc.sr.142.113.1995.
Bounakhla, Moussa, and Tahri, Mounia. X-Ray Fluorescence Analytical Techniques, CNESTEN. Brouwer, Peter N. Theory of XRF. Getting acquainted with the principles. The Netherlands, Almelo: PANalytical B. V., 2010.
Brunetti, Bruno, Milianic, Costanza, Rosi, Francesca, Doherty, Brenda, Monico, Letizia, Romani, Aldo, and Sgamellotti, Antonio. “Non invasive investigation of paintings by portable instrumentation: the MOLAB experience.” Topics in Current Chemistry (Z) 374 no. 10 (2016): 1-35. doi:10.1007/s41061-015-0008-9.
Busch, Laura. “Analysis of the state of the art: XRF.” Spectroscopy 30 no. 6 (2015): 1-12. http://www.spectroscopyonline.com/.
Campbell, Ian, Xiao, Youhong, Vrebos, Bruno, Kempenaers, Lieven, Coler, David, and Macchiarola, Katherine. “The use of EDXRF for pharmaceutical material elemental analysis.” American Pharmaceutical Review.http://www.americanpharmaceuticalreview.com/.
Čechák, Tomas, Kopecká, I., Trojek, Tomas, Štanzel, T., and Bártová, H. “Application of X-ray fluorescence in an investigation of photographic heritage.” Radiation Physics and Chemistry 116 (2015): 8-13. doi:10.1016/j.radphyschem.2015.05.015.
Chan, Jason C. and Palmer, Peter T. “Determination of Calcium in Powdered Milk via X-ray Fluorescence Using External Standard and Standard Addition Based Methods.” Journal of Chemical Education 90 (2013): 1218-1221. doi:10.1021/ed4001975.
Chen, Lin X., Zhang, Xiaoyi, and Shelby, Megan L. “Recent advances on ultrafast X-ray spectroscopy in the chemical sciences.” Chemical Science 5 (2014): 4136-4152. doi:10.1039/c4sc01333f .
Christensen, Angi M., Smith, Michael A., and Thomas, Richard M. “Validation of X-Ray Fluorescence Spectrometry for determining osseous or dental origin of unknown material.” Journal of Forensic Science 57 no. 1 (2012): 47-51. doi:10.1111/j.1556-4029.2011.01941.x.
Clark III, Benton C., Baird, A.K., Rose Jr, Harry J., Toulman III, Priestley, Christina, Ralph P., Kelliher, Warren C., Castro, Angelo J., Rowe, Catherine D., Keil, Klaus, and Juss, Gary R. “The Viking X-ray fluorescence experiment: analytical methods and early results.” Journal of Geophysical Research 82 no. 28 (1977): 4577-4594. doi:10.1029/JS082i028p04577. Cotte, Marine, and Susini, Jean. “Art, spectres et rayons X.” L’actualité chimique 356-357 (2011): 113-115.
Crawford, Elisabeth. The Beginnings of the Nobel Institution.The Science Prizes, 1901-1915. Cambridge: Cambridge University Press, 1987.
D’Cunha, P., and Nayarana, Y. “Comparison of methodologies of gammaray spectrometer and X-ray fluorescence.” Indian Journal of Pure and Applied Physics 50 (2012): 524-526. http://nopr.niscair.res.in/bitstream/.
de Brito, José A. A. “Statistical and mathematical concepts and principles applicable to uncertainty calculations for the measurement of In Vivo bone lead by 109Cd K X ray fluorescence.” Journal of Biometrics and Biostatistics 3 no. 1 (2012): 1-7. doi:10.4172/2155-6180.1000133
Demirdjian, Hagop. La radiographie(I) –histoire de la découverte des rayons X et de leur application in médicine, http://culturesciences.chimie.ens.fr/la-radiographie-i-histoire-de-la-découverte-des-rayons-x-et-de-leur-application-en-médecine (01/10/2007).
Devi, P. S. Remya, Trupti, A. Chavan, Nicy, Ajith, Dalvi, Aditi A., Swain, Kallola K., Wagh, D. N., and Verma, Rakesh. “Evaluation of uncertainty in the energy dispersive X-ray fluorescence determination of platinum in alumina.” Analytical Methods 7 (2015): 1-10. doi:10.1039/C5AY00547G.
Dolenko, George N., Poleshchuk, Oleg Kh, and Latosinska, Jolanda N. “X-Ray Emission Spectroscopy Methods.” In Encyclopedia of Spectroscopy and Spectrometry, 3th ed., Eds., Lindon, John C., Tranter, George E., Koppenaal, David W., London: Elsevier, 2017, Vol. 4, 691-694.
Dörfel, G. “Röntgens merkwürdige Bestellungein Beitrag zur Entdeckungsgeschichte der Röntgenstrahlen.” Fortschr Röntgenstr 182 no. 10 (2010): 879-882.
Eckert, Michael. “Max von Laue and the discovery of X-ray diffraction in 1912.” Annals Physics (Berlin) 524 no. 5 (2012): A83-A85. doi:10.1002/andp.201200724.
EPA Method 6200, Field portable X-ray fluorescence spectrometry for the determination of elemental concentration in soil and sediment, February 2007.
Fernandes, Tânia A. P., Brito, José A. A., and Gonçalves, Luísa M. L. “Analysis of micronutrients and heavy metals in Portuguese infant milk powders by wavelength dispersive X-ray fluorescence spectrometry (WDXRF).” Food Analytical Methods 8 no. 1 (2015): 52-57. doi:10.1007/s12161-014-9866-y.
Ferretti, Marco. “The Investigation of Ancient Metal Artefacts by Portable X-Ray Fluorescence Devices.” Journal of Analytical Atomic Spectrometry 29 no. 10 (2014): 1753–1766.doi:10.1039/C4JA00107A.
Figueiredo, Alexandra, Fernandes, Tânia, Costa, Isabel Margarida, Gonçalves, Luísa, and Brito, José. "Feasibility of Wavelength Dispersive X-Ray Fluorescence Spectrometry for the Determination of Metal Impurities in Pharmaceutical Products and Dietary Supplements in View of Regulatory Guidelines." Journal of Pharmaceutical and Biomedical Analysis 122 (2016): 52–58. doi:10.1016/j.jpba.2016.01.028.
Forman, P. “The discovery of the diffraction of X-rays by crystals; a critique of the myth.” Archive for the History of Exact Sciences 6819 (1969): 38-71.http://www.jstor.org/stable/41133294.
Gajić-Kvaščev, Maja D., Marić-Stojanović, Milica D., Jančić-Heinemann, Radmila M., Kvaščev, Goran S., Andrić, Velibor. “Non-Destructive Characterisation and Classification of Ceramic Artefacts Using pEDXRF and Statistical Pattern Recognition.” Chemistry Central Journal 6 no. 1 (2012): 102. doi:10.1186/1752-153X-6-102.
Galli, Simona. “X-ray Crystallography: One Century of Nobel Prizes.” Journal of Chemical Education 91 (2014): 2009−2012. doi:10.1021/ed500343x.
Garrote, Marco Aurelio, Robader, María Dolores, and Perez-Rodriguez, José Luis. “Analytical investigation of Mudejar polychrome on the carpentry in the Casa de Pilatos palace in Seville using non destructive XRF and complementary techniques.” Spectrochimica ActaA 173 (2017): 279-291. doi:10.1016/j.saa.2016.09.027.
Guerra, Mauro, Ferreira, C., Carvalho, María L., Santos, José Paulo, Pessanha, Sofia. “Distribution of Toxic Elements in Teeth Treated with Amalgam Using μ-Energy Dispersive X-Ray Fluorescence.” Spectrochimica Acta - Part B Atomic Spectroscopy 122 (2016): 114–117. doi:10.1016/j.sab.2016.06.006.
Hafez, Iosif T., Sorrentino, Giusi, Faka, Marina, Cuenca-García, Carmen, Makarona, Christina, Charalamblus, Andreas, Nys, Karin, and Hermon, Sorin. “Geochemical survey of soil samples from the archaeological site Dromolaxia-Vyzakia (Cyprus), by means of micro-XRF and statistical approaches.” Journal of Archaelogical Science 11 (2017): 447-462. doi:10.1016/j.jasrep.2016.12.023.
Heginbotham, A., Bezur, A., Bouchard, M., Davis, Jeffrey M., Eremin, Katherine, et al. “An evaluation of inter-laboratory reproducibility for quantitative XRF of histotic copper alloys.” Metal 2010, Proceedings of the Interim Meeting of the IOM-CC Metal Working Group, Mardikian, Paul, Chemello, Claudia, Watters, Christopher, Hull, Peter (Eds.), October 11-15, 2010, Charleston, South Caroline, USA: Clenson University, SA, 2011, 244-255.
Hubbell, J. H., Trehan, P. N., Singh, N., Chand, B., Mehta, D., Garg, M. L., Garg, R. R., Singh, S., and Puri, S. “A review, bibliography, and tabulation of k, l, and higher atomic shell x-ray-fluorescence yields.” Journal of Physical and Chemical Reference Data 23 no. 2 (1994): 339-364. doi:10.1063/1.1756152.
Hurwic, Józef. “W.C. Röntgen et la découverte des rayons X.”L’actualité chimique 68 (1980) 41-46. Janssens K. “X-ray based methods of analysis”. In Modern Methods for Analyzing Archaeological and Historical Glass, ed. Janssens, J., Vol. I, New York: Wiley, 2013, 79-128.
Janssens, K. “X-ray based method of analysis.” In Comprehensive Analytical Chemistry, Vol. 42, Non-Destructive Microanalysis of Cultural Heritage Materials, Amserdam: Elsevier, 2004, 119-126.
Jenkins, Ron, Manne, R., Robin, R., and Senemand C. “Nomenclature system for X-Ray spectroscopy.” Pure and Applied Chemistry 63 no. 5 (1991): 735-746. doi:10.1351/pac199163050735.
Jenkins, Ron. “X-ray Fluorescence Analysis.” Analytical Chemistry 56 no. 9 (1984): 1099A–1106A. doi:10.1021/ac00273a003.
Jenkins, Ron. Wavelength-dispersive X-ray Fluorescence Analysis.Encyclopedia of Analytical Chemistry. Ed., Meyers, R. A., New York: Wiley, 2000.
Jenkins, Ron. X-Ray Fluorescence Spectrometry.2nd ed., Wiley, New York, 1999.
Jenkins, Ron. “X-ray Techniques: Overview.” In Encyclopedia of Analytical Chemistry, Ed., Meyers R. A., New York: Wiley, 2000.
Jenkins, Ronal. “X-Ray Fluorescence Analysis.” In X-ray Characterization of Materials, Ed., Lifshin, Eric, Weinheim: Wiley-VCH, 2008, 171-210.
Klockenkämper, Reinhold, Knoth, Joachin, Prange, Andreas, and Schwenke, Heinrich. “Total-Reflection X-Ray Fluorescence Spectroscopy.” Analytical Chemistry 64 no. 23 (1992): 1101A-1107A. doi:10.1021/ac00047a704.
Klockenkämper, Reinhold, von Bohlen, Alex. Total Reflection X-Ray Fluorescence Analysis and Related Compounds. New York: Wiley, 2015.
Kondrashov, V. S., and Rothenberg, Stephen. “How to calculate lead concentration and concentration uncertainty in XRF in vivo bone lead analysis.” Applied Radiation and Isotopes 55 no. 6 (2001): 799-803. doi:10.1016/S0969-8043(01)00121-X.
Kramar, Utz. “X-Ray Fluorescence Spectrometers.” In Encyclopedia of Spectroscopy and Spectrometry, 3th ed., Vol. 4, Eds., Lindon, J. C., Tranter, G. E., Koppenaal, D. W., London: Elsevier, 2017, 695-706.
Madariaga, Juan Manuel. “Analytical chemistry in the field of cultural heritage.” Analytical Methods 7 (2015): 4848-4876. doi:10.1039/c5ay00072f.
Manso, Marta, Pessanha, Sofía, Guerra, Mauro, Figeirinhas, João L., Santos, José Paulo, and Carvalho, María L. “Unveiling the third secret of Fatima: [math]\mu[/math]-XRF quantitative characterization and 2D elemental mapping.” Spectrochimica Acta B 130 (2017): 35-38. doi:10.1016/j.sab.2017.02.006.
Mantler, Michael, and Klikovits, Ja. “Analysis of art objects and othe delicate samples: is XRF really on-destructive?.” Power Difraction 19 no. 1 (2004): 16-19. doi:10.1154/1.1649962.
Margaritondo, G., Ramachandra Rao, M. S. “The chance of a bullet: when the great war killed Henry Moseley.” Journal of Physics D: Applied Physics 48 (2015): 500302 (2pp). doi:10.1088/0022-3727/48/50/500302.
Marguí, Eva, Queralt, Ignasi, and Hidalgo, Manuela. “Application of X-ray fluorescence spectrometry to determination and quantitation of metals in vegetal material.” Trends in Analytical Chemistry 28 no. 3 (2009): 362-372. doi:10.1016/j.trac.2008.11.011.
Marguí, Eva, and Van Grieken, René. “State-of-the art of X-ray fluorescence instrumentation for chemical analysis.” Petro Industry News (GBR) (2013). https://www.petro-online.com/.
Marguí, Eva, and Van Grieken, René. X-ray Fluorescence Spectrometry and Related Techniques: an Introduction. New York: Momentum Press LLC, 2013.
Marguí, Eva, Hidalgo, Manuela, and Queralt, Ignasi. “XRF spectrometry for trace element analysis of vegetation samples.” Spectroscopy Europe 19 no. 3 (2007): 13-17. http://www.spectroscopyeurope.com/.
Marguí, Eva, Queralt, Ignasi, and Van Grieken, René. Sample preparation for X-ray fluorescence analysis, in Encyclopedia of Analytical Chemistry (EAC).Ed., Meyers, R. A., John Willey & Sons (www.wileyeurope.com).
Marguí, Eva, Van Grieken, René, Fontàs, C., Hidalgo, Manuela, and Queralt, Ignasi. “Preconcentration methods for the analysis of liquid samples by X-ray spectrometric techniques.” Applied Spectroscopy Review 45 (2010): 179-205. doi:10.1080/05704920903584198.
Marguí, Eva, Zawisza, Beata, and Sitko, Rafal. “Trace and ultratrace analysis of liquid samples by X-ray fluorescence spectrometry.” Trends in Analytical Chemistry 53 (2014): 73-83. doi:10.1016/j.trac.2013.09.009.
Markowicz, A. “An overview of quantification methods in energy-dispersive X-ray fluorescence analysis.” Pramana - Journal of Physics 76 no. 2 (2011): 321-329. doi:10.1007/s12043-011-0045-z.
Mattsson, Sören, and Börjesson, Jimmy. “X-ray fluorescence in medicine.” Spectroscopy Europe 20 no. 3 (2008): 13-17. http://www.spectroscopyeurope.com/.
Mbaye, M., Traore, A. S. Ndao, Wague A. “Multivariate Statistical Techniques to Determine Essential and Toxic Elements in Biological Samples by X-Ray Fluorescence.” Instrumentation Science and Technology 43 (2014): 141218223956000. doi:10.1080/10739149.2014.991967.
Mir-Marqués, Alba, Maria Martínez-García, Salvador Garrigues, M. Luisa Cervera, and Miguel De La Guardia. “Green Direct Determination of Mineral Elements in Artichokes by Infrared Spectroscopy and X-Ray Fluorescence.” Food Chemistry 196 (2016): 1023–1030.doi:10.1016/j.foodchem.2015.10.048.
Moradi, Morteza, Yamini, Yadollah, Kakehmam, Jamal, and Ahmadi, Kamran. “A review in the sample preparation of aqueous solutions combined with X-ray fluorescence detection.” Journal of the Iranian Chemical Society 12 (2015): 831–838.doi:10.1007/s13738-014-0545-0.
Morgenstern Peter, Brüggemann, L., Wennrich, Rainer. “Effect of the sample matrix on measurement uncertainty in X-ray fluorescence analysis.” Spectrochimica Acta B 60 no. 9-10 (2005): 1373-1379. doi:10.1016/j.sab.2005.08.005.
Morgenstern Peter, Brüggemann, L., Wennrich, Rainer. “Validation of an X-Ray Methodology with Environmental Concern.” Spectrochimica Acta - Part B Atomic Spectroscopy 59 no. 2 (2004): 185–197.doi:10.1016/j.sab.2003.11.007.
Morikawa, Atsushi. “Sample preparation for X-ray fluorescence analysis. II. Pulverizing methods of power samples.” Rigaku Journal 30 no. 2 (2014): 23-27.
Moriyama, Takao, Furusawa, Eichi. “Sample preparation for X-ray fluorescence analysis VI. Metal samples.” Rigaku Journal 32 no. 2 (2016): 19-22.
Moriyama, Takao, Morikawa, Atsuchi. “Sample preparation ofr X-ray fluorescence analysis VII. Liquid samples.” Rigaku Journal 33 no. 1 (2017): 24-29.
Mould, R. F. “The early history of x-ray diagnosis with emphasis on the contributions of physics 1895-1915.” Physics in Medicine and Biology 40 no. 11 (1995): 1741-1787. doi:10.1088/0031-9155/40/11/001.
Musılek, Ladislav, Cechak, Tomás, and Trojek , Tomás. “X-ray fluorescence in investigations of cultural relics and archaeological finds.” Applied Radiation and Isotopes 70 (2012): 1193-1202. doi:10.1016/j.apradiso.2011.10.014.
Naik, Prasad A. “X-Ray Spectroscopy, Theory.” In Encyclopedia of Spectroscopy and Spectrometry, 3th ed., Vol. 4, Eds., Lindon, John C., Tranter, George E. and Koppenaal, David W., London: Elsevier, 2017, 725-734.
Navas, María José, Garcia Asuero, Agustin, and Jimenez, Ana María. “A Review of Energy Dispersive X-Ray Fluorescence (EDXRF) as an Analytical Tool in Numismatic Studies. Applied Spectroscopy 70 no. 1 (2016): 207-221. doi:10.1177/0003702815616594.
O’Meara, Joanne M., and Fleming, David E. “Uncertainty calculations for the measurement of in vivo bone lead by X-ray fluorescence.” Physics in Medicine and Biology 54 no. 8 (2009): 2449-2461. doi:10.1088/0031-9155/54/8/013.
Palmer, Peter T. “Energy-Dispersive X-ray Fluorescence Spectrometry: A Long Overdue Addition to the Chemistry Curriculum.” Journal of Chemical Education 88 no. 7 (2011): 868–872.doi:10.1021/ed200254v.
Palmer, Peter T., Jacobs, Richard, Baker, Peter E., Ferguson, Kelly, and Webber, Siri. “Use of Field-Portable XRF Analyzers for Rapid Screening of Toxic Elements in FDA-Regulated Products.” Journal of Agriculture and Food Chemistry 57 (2009): 2605-2613. doi:10.1021/jf803285h.
Patnaik, Pradyot. Dean’sAnalytical Chemistry Handbook. New York: McGraw-Hill, 2004.
Pereira, A. M. T., and Brandao, Paulo Roberto Gomes. “Statistical validation of standardless and standard-based analysis by X-Ray fluorescence spectrometry in iron ores characterization.” Minerals Engineering 14 no. 12 (2001): 1659-1670.doi:10.1016/S0892-6875(01)00184-4.
Perring, Loïc, andtry in iron ores characterization.” Minerals Engineering 14 no. 12 (2001): 1659-1670.doi:10.1016/S0892-6875(01)00184-4. Blanc, Joëlle. “Faster measurement of minerals in milk powders: comparison of a high power wavelength dispersive XRF system with ICP-AES and potentiometry reference methods.” Food Analytical Methods 1 no. 3 (2008): 205-213. doi:10.1007/s12161-008-9030-7.
Perring, Loïc, Nicolas, Marine, Andrey, Danaiel, Rime, Céline Fragnière, Richoz-Payot, Janique, Dubascoux, Stéphane, and Poitevin, Eric. “Development and validation of an ED-XRF method for the fast quantification of mineral elements in dry pet food samples.” Food Analytical Methods 10 no. 5 (2017): 1469–1478. doi:10.1007/s12161-016-0695-z.
Potts, Philip J., Ellis,Andrew T., Holmes,Mike, Kregsamer,Peter, Christina, Streli, West,Margaret, and Wobrauschek, Peter. “X-ray Fuorescence spectrometry.” Journal of Analytical Atomic Spectrometry 15 (2000): 1417-1442. doi:10.1039/b005284l.
Pytlakowska, Katarzyna. “Graphene-Based Preconcentration System Prior to Energy Dispersive X-Ray Fluorescence Spectrometric Determination of Co, Ni, and Cu Ions in Wine Samples.” Food Analytical Methods 9 no. 8 (2016): 2270–2279. doi:10.1007/s12161-016-0412-y.
Reed, Stephen J. B. “Electron microprobe microanalysis.” In Microprobe Techniques in the Earth Sciences, Eds., Potts, Phillip J., Bowles, John F. W., Reed, Stephen J.B., and Cave, Mark R., London: Chapman & Hall, 1995, 49-90.
Revenko, Anatolyi G. “Development of X-Ray fluorescence analysis in Russia in 1991-2010.” Journal of Analytical Chemistry 66 no. 11 (2011): 1174-1187. doi:10.1134/S1061934811110116.
Revenko, Anatolyi G. “Estimation and account for matrix effects in studying glass materials of cultural heritage by X-ray spectral analysis.” X-Ray Spectrometry 39 no. 1 (2010): 63–69.doi:10.1002/xrs.1223.
Revenko, Anatolyi G. “On the 40th anniversary of the journal X-Ray Spectrometry.” X-Ray Spectrometry 41 (2012): 117-124. doi:10.1002/xrs.2383.
Revenko, Anatolyi G. “X-ray fluorescence analysis: State-of-the-art and trends of development.” Industrial Laboratory 66 no. 10 (2000): 637-652. doi:10.1023/A: 1017551622466.
Robinson, James W., Frame, Eileen M. Skelly, and Frame, George M. “Undergraduate Instrumental Analysis.” In X-Ray Spectroscopy, 7th Ed., Boca Raton, Fl: CRC Press, 2014, 595-704.
Rouessac, Francis, and Rouessac, Annick. “Chemical Analysis. Modern Instrumentation Methods and Techniques.” In X-Ray Fluorescence Spectrometry, 2nd ed., New York: Wiley, 2007, 262-283.
Rousseau, Richard M. “Correction for matrix effects in X-ray fluorescence analysis – a tutorial.” Spectrochimica Acta B 45, nº 3 (2006): 759-777.doi:10.1016/j.sab.2006.06.014.
Rousseau, Richard M. “Detection limit and estimate of uncertainty of analytical XRF results.” The Rigaku Journal 18 no. 2 (2001): 33-47.
Rousseau, Richard M. “How to apply the fundamental parameters method to the quantitative X-ray fluorescence analysis of geological materials.” Journal of Geosciences and Geomatics 1 no. 1 (2013): 1-7. doi10.12691/jgg-1-1-1.
Rousseau, Richard M. “The quest for a fundamental algorithm in X-ray fluorescence analysis and calibration.” The Open Spectroscopy Journal 3 (2009): 31-42. https://benthamopen.com/.
Rowe, Harry, Niki Hughes, and Krystin Robinson. “The Quantification and Application of Handheld Energy-Dispersive X-Ray Fluorescence (ED-XRF) in Mudrock Chemostratigraphy and Geochemistry.” Chemical Geology 324–325 (2012): 122–131.doi:10.1016/j.chemgeo.2011.12.023.
Sanchez-Ramos, Sinforiano, Bosch-Reig, Francisco, Gimeno-Adelantado, José Vicente, Yusá-Marco, Dolores Julia, Doménech-Carbó, Antonio, and Berja-Pérez, J.A. “Validation of a method for the determination of boron in ceramic materials by X-ray fluorescence spectrometry.” Spectrochimica Acta B 55 (2000): 1669-1677. doi:10.1016/S0584-8547(00)00267-6.
Sarton, G. “Mosely: the numbering of the elements.” Isis 9 no. 1 (1927): 96-111.
Sauvage-Simkin, Michèle. “Le rayonnement synchrotron au service des problématiques de la chimie.”L’actualité chimique 356-357 (2011): 6-13.
Sayerx, Zehra, Avsar, Bihter, Cholak, Ersoy, and Karmous, Ines. “Application of advanced X-ray methods in life sciences.” Biochimica et Biophysica Acta 1861 no. 1 (2017): 3671-3685.doi:10.1016/j.bbagen.2016.05.008.
Scapin, Marcos A., Salvador, Vera L.R., Cotrim, Marycel E. B., Pires, Maria A. F., and Sato, Ivone M. “Uncertainty measurement evaluation of WDXRF and EDXRF techniques for the Si and Utotal determination of U3Si2 nuclear fuel.” Journal of Radioanalytical Nucleat Chemistry 287 (2011): 807-811. doi:10.1007/s10967-010-0897-6.
Scharnweber, Tobias, Andrea Hevia, Allan Buras, Ernst van der Maaten, and Martin Wilmking. “Common Trends in Elements? Within- and between-Tree Variations of Wood-Chemistry Measured by X-Ray Fluorescence - A Dendrochemical Study.” Science of the Total Environment 566–567 (2016): 1245–1253.doi:10.1016/j.scitotenv.2016.05.182.
Sciutto, Giorgia, Oliveri, Paolo, Prati, Silvia, Quaranta, Marta, and Bersani, Silvia. “An advanced multivariate approach for processing X-ray fluorescence spectral and hyperspectral data from non-invasive in situ analyses on painted surfaces.” Analytical Chimica Acta 752 (2012): 30-38. doi:10.1016/j.aca.2012.09.035.
Seliger, Howard. Wilhelm Conrad Röntgen and the glimmer of light.Physics Today 48 no. 11 (1995): 25-31. doi:10.1063/1.881456.
Sepúlveda, Marcela, Gutierrea, Sebastian, Carcamo, José, Oyaneder, Adrian, Valenzuel, Daniela, Montt, Indira, and Santoro, Calogero M. “In situ x-ray fluorescence analysis of rock art paintings along the coast and valleys of the Atacama desert, northern Chile.” Journal of the Chilean Chemical Society 60 no 1 (2015): 2822-2826. doi:10.4067/S0717-97072015000100010.
Shackley, M. Steven. “An Introduction to X-Ray Fluorescence (XRF) Analysis in Archaeology.” Chapter 2. In X-Ray Fluorescence Spectrometry (XRF) in Geoarchaeology 7 (2011): 7-44. doi:10.1007/978-1-4419-6886-9_2.
Shimadzu Corporation. X-Ray Analysis. The use of EDX Fluorescence spectrometry for Pharmaceutical Elemental Impurity Analysis Based on USP. December 2016.
Sitko, Rafal and Zawisza, Beata. “Quantification in X-Ray Fluorescence Spectrometry.” In X-Ray Spectroscopy, Ed., Shatendra, Dr. and Sharma, K., Rijeka: Intech, 2012.
Sitko, Rafal. “Correction of matrix effects via scattered radiation in X-ray fluorescence analysis of samples collected on membrane filters.” Journal of Analytical Atomic Spectrometry 21 no. 10 (2006): 1062-1067. doi:10.1039/B604955A.
Sitko, Rafal. “Quantitative X-ray fluorescence analysis of samples less tan ‘infinite thickness’: difficulties and possibilities.” Spectrochimica Acta B 64 (2009): 1161-1172. doi:10.1016/j.sab.2009.09.005.
Sitko, Rafal. “Theoretical influence coefficients for correction of matrix effects in X-ray fluorescence analysis of intermediate thickness samples.” X-Ray Spectrometry 35 no. 2 (2006); 93-100.doi:10.1002/xrs.867.
Skoog, Douglas A., Holler, F. James, and Crouch, Stanley R. “Principles of Instrumental Analysis.” In Atomic X-Ray Spectrometry, 7th ed., Boston, MA: Centage Learning, 2017, 274-300.
Slanoudis, Ioannis, Drakaki, Eleni, Hein, Anno. “Educational X-ray experiments and XRF measurements with a portable setup adapted for the characterization of cultural heritage objects.” European Journal of Physics 31 no. 3 (2010): 419-431. doi:10.1088/0143-0807/31/3/001.
Smagunova, Antonina Nikonouna, Bolormaa, Oyntseteg, and Panikov, Sergei Dimitrovic. “Determination of the optimum conditions for X-Ray fluorescence analysis using coupling equations.” Journal of Analytical Sciences, Methods and Instrumentation 2 (2012): 81-86. doi:10.4236/jasmi.2012.22015.
Streli, Christina, Wobrauschek, P., and Kregsamer, P. “X-Ray Fluorescence Spectroscopy, Applications.” In Encyclopedia of Spectroscopy & Spectrometry, 3th ed., Vol. 4, Eds., Lindon, J., Tranter, G., Holmes, J. Lindon, J. C., Tranter, G. E., and Koppenaal, D. W., London: Elsevier, 2017; 707-715.
Stuzman, Paul, and Heckert, Alan. Performance criteria for an ASTM XRF Standard Test Mehtod for hydraulic cements: inter-laboratory study on cements A and B, NIST Technical Note 1816, NIST: Washington DC, 2013.
Takahashi, Gakuto. “Sample preparation for X-ray fluorescence analysis III Pressed and loose powders methods.” Rigaku Journal 31 no. 1 (2015): 26-30.
Thomas, John Meurig. “William Lawrence Brag: the pioneer of X-tray crystallography and his pervasive influence.” Angewandte Chemie International Edition 51 no. 52 (2012): 12946-12958.
Thomsen, Volker. Basic fundamental parameters in X-ray fluorescence.Spectroscopy 22 no. 5 (2007): 46-50. http://www.spectroscopyonline.com/.
Todd, Andrew C., Moshier, Erin L., Carroll, Spencer, and Casteel, Stanley W. “Validation of X-Ray fluorescence-measured swine femur lead against atomic absorption spectrometry.” Environmental Health Perspectives 109 (2001): 1115-1119. https://www.ncbi.nlm.nih.gov/.
Traore A, Ndiaye, P. M., Mbaye, M., Diatta, F., Wague, A. “X-ray fluorescence combined with chemometrics for the characterization of geological samples : a case study in southeastern.” Instrumentation Science & Technology 42 no. 5 (2014): 1–14.doi:10.1080/10739149.2014.915564.
Tsuji, Kouichi, Injuk, Jasna, and van Grieken, René. X-Ray Spectrometry: Recent Technological Advances. Chichester: Wiley, 2004. Tsuji, Kouichi, Matsuno, Tsuyoshi, Takimoto, Yuki, Yamanashi, Masaki, Kometani, Noritsugu, Sasaki, Yuji C., Hasegawa, Takeshi, Kato, Shuichi, Yamada, Takashi, Shoji, Takashi, and Kawahara, Naoki. “New developments of X-ray fluorescence imaging techniques in laboratory.” Spectrochimica Acta Part B 113 (2015): 43–53. doi:10.1016/j.sab.2015.09.001.
Van Grieken, Rene, Markowicz, A. Handbook of X-Ray Spectrometry. 2nd ed., New York: Marcel Dekker, 2002.
Variankaval, Narayan. “X-Ray Methods.” In Ewing’s Analytical Instrumentation Handbook, 3th ed., Ed., Cazes, Jack, New York: Marcel Dekker, 2005, 239-256.
Wandzilak, Aleksandra, Czyzycki, Mateusz, Radwanska, Edyta, Adamek, Dariusz, Geraki, Kalotina, and Lankosz Marek. “X-ray fluorescence study of the concentration of selected trace nad minor elements in human brain tumours.” Spectrochimica Acta B 114 no. 1 (2015): 52-57. doi:10.1016/j.sab.2015.10.002.
Watanabe, Mitsuru. “Sample preparation for X-ray fluorescence analsisis IV. Fusion bead method –part 1: basic principles.” Rigaku Journal 31 no. 2 (2015): 12-17.
Watanabe, Mitsuru. “Sample preparation for X-ray fluorescence analysis V. Fusion bead method –part 2: practical applications.” Rigaku Journal 32 no. 1 (2016): 17-21.
Whiston, Clive. X-Ray Methods. Chichester: ACOL, Wiley, 1987.
Wilis, James P., and Lachance, Gerald. R. “Comparison between some common influence coefficient algorithms.” X-Ray Spectrometry 33 (2004): 181-188. doi:10.1002/xrs.681.
Willis, James P., and Lachance, Gerald R. “Resolving apparent differences in mathematical expressions relating intensity to concentration in X-ray fluorescence spectrometry.” The Rigaku Journal 17 no. 1 (2000): 23-33.
Woods, Gordon. “Henry Moseley (1887-1915) a sad loss to the world of science.” School Science Review 97 no. 359 (2015): 81-88. Yamada, Yasujiro. “Sample preparation for X-ray fluorescence analysis I. Outline of sample preparation.” Rigaku Journal 30 no. 1 (2014): 26-29.
Young, Kelsay E., Evans, Cynthia A., Hodges, Kip V., Bleacher, Hacob E., and Graff, Trevor G. “A review of the handheld X-Ray fluorescence spectrometer as a tool for field geologic investigations on Earth and planetary surface exploration.” Applied Geochemistry 72 (2016): 77-87. doi:10.1016/j.apgeochem.2016.07.003.
