Difference between revisions of "Fluorescence Lifetime Imaging Microscopy Quantitative Measurements"
(→2. Frequency Domain (FD) FLIM) |
(→2. Frequency Domain (FD) FLIM) |
||
| Line 28: | Line 28: | ||
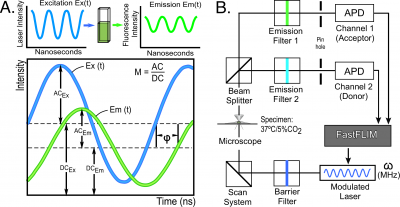
The FLIM techniques are broadly subdivided into time domain and frequency domain (FD) methods. The physics that underlies these two methods is identical, but they differ in how the signals are analyzed [8]. The frequency domain (FD) FLIM approach described here excites the fluorophores with a light source that is modulated at high frequencies, typically between 10 to 300 megahertz (MHz). Since the excitation source is modulated, the emission from the fluorophores will also be modulated. However, because of the persistence of the excited state there will be a phase delay (<math>\Phi</math>) and a change in the modulation (<math>M</math>) of the emission signal relative to the corresponding excitation waveform (Figure 2A). The fluorescence lifetime (<math>\tau_{f}</math>) can be determined directly from the <math>\Phi_{\tau_{p}}</math> and the <math>M_{\tau_{m}}</math> of the emission signal for each excitation frequency: | The FLIM techniques are broadly subdivided into time domain and frequency domain (FD) methods. The physics that underlies these two methods is identical, but they differ in how the signals are analyzed [8]. The frequency domain (FD) FLIM approach described here excites the fluorophores with a light source that is modulated at high frequencies, typically between 10 to 300 megahertz (MHz). Since the excitation source is modulated, the emission from the fluorophores will also be modulated. However, because of the persistence of the excited state there will be a phase delay (<math>\Phi</math>) and a change in the modulation (<math>M</math>) of the emission signal relative to the corresponding excitation waveform (Figure 2A). The fluorescence lifetime (<math>\tau_{f}</math>) can be determined directly from the <math>\Phi_{\tau_{p}}</math> and the <math>M_{\tau_{m}}</math> of the emission signal for each excitation frequency: | ||
| − | <math>\tau_{p}=\tan (\Phi )\text{and}\tau_{m}=\sqrt{\frac{1}{M^2}-1}\tag 3</math> | + | <math>\tau_{p}=\tan (\Phi )\\text{and}\tau_{m}=\sqrt{\frac{1}{M^2}-1}\tag 3</math> |
Revision as of 16:16, 16 February 2017
Department of Cellular and Integrative Physiology, Indiana University School of Medicine, 635 Barnhill Dr., Indianapolis, IN 46202 USA.
1. A Brief History of the Measurement of Fluorescence Lifetimes

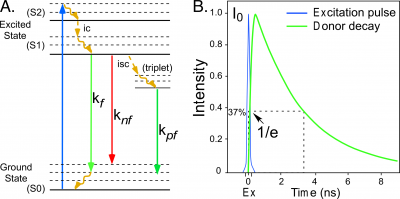
Fluorescence describes the emission of light by an atom or molecule that follows the absorption of electromagnetic energy [1]. When a fluorescent molecule absorbs energy, it is driven into an excited state that persists for a brief time. The molecule then transitions back to the lower energy ground state by one of several possible pathways. Some of the pathways for de-excitation to the ground state are illustrated in the simplified Jabłoński-Perrin diagram in Figure 1. The pathways include internal conversion ([math]ic[/math]), decay by fluorescence ([math]k_{f}[/math]), quenching (loss of excitation energy without the emission of light, [math]k_{nf}[/math]), or intersystem crossing ([math]isc[/math]) to the triplet state followed by decay by phosphorescence ([math]k_{pf}[/math]).The average time required for a population of fluorophores in the excited state to decay to the ground state is called the fluorescence lifetime, which is described by an exponential function (Figure 1):
[math]I(t)=I_{0}e^{-t/\tau}\tag 1[/math]
where [math]I(t)[/math] is the fluorescence impulse response at time [math]t[/math], [math]I_{0}[/math] is the initial intensity after the excitation pulse, and [math]\tau[/math] is the fluorescence lifetime.
The measurement of excited-state lifetimes began in the mid-eighteenth century with the studies of phosphorescent materials by Alexandre-Edmond Becquerel, who was the first to measurethe exponential decay of phosphorescence over time [2, 3]. In the early 1920’s Robert Wood illuminated a heated vapor of mercury and demonstrated that the emission of light was displaced in the moving vapor relative to the excitation spot. He then used the velocity of the vapor to determine the lifetime [4].Two years later, Phillip Gottling used an improved version of Wood’s approach to determine that the excited-state lifetime of rhodamine was twenty nanoseconds. He proposed that the “exciting energy was imprisoned for a short but definite and measurable interval of time” within the fluorescent molecule [5]. The excited-state events observed by Becquerel, Wood, and Gottling are explained by the Bohr model of the atom, which describes how the absorption of energy causes electrons to move from inner to outer stable orbits, with their return to the original orbit being coupled to the emission of quanta of light [6].
In 1926, Enrique Gaviola developed the phase fluorometer, an instrument designed specifically for lifetime measurements. Gaviola's fluorometer was the first instrument that could accurately measure nanosecond fluorescence lifetime decays [7]. This enabled Gaviola to demonstrate how events in the probe environment competing in the deactivation from the excited state (Figure 1) cause the fluorescence lifetime to change. Therefore, the measured fluorescence lifetime ([math]\tau_{f}[/math]) represents the combination of the radiative ([math]k_{f}[/math]) and non-radiative ([math]k_{nf}[/math]) decay rates for the transition from the excited state:
[math]\tau_{f}=\frac{1}{k_{f}+k_{nf}}\tag 2[/math]
Fluorescence lifetime imaging microscopy (FLIM) is a technique that can be used to quantify the duration of the excited state, and thus quantify events that affect the excited state of a fluorophore. FLIM detects the changes in fluorescence lifetimes on the time scales of nanoseconds, and is routinely used to measure protein interactions or signaling events as they occur within living cells.
1 2. Frequency Domain (FD) FLIM
The FLIM techniques are broadly subdivided into time domain and frequency domain (FD) methods. The physics that underlies these two methods is identical, but they differ in how the signals are analyzed [8]. The frequency domain (FD) FLIM approach described here excites the fluorophores with a light source that is modulated at high frequencies, typically between 10 to 300 megahertz (MHz). Since the excitation source is modulated, the emission from the fluorophores will also be modulated. However, because of the persistence of the excited state there will be a phase delay ([math]\Phi[/math]) and a change in the modulation ([math]M[/math]) of the emission signal relative to the corresponding excitation waveform (Figure 2A). The fluorescence lifetime ([math]\tau_{f}[/math]) can be determined directly from the [math]\Phi_{\tau_{p}}[/math] and the [math]M_{\tau_{m}}[/math] of the emission signal for each excitation frequency:
[math]\tau_{p}=\tan (\Phi )\\text{and}\tau_{m}=\sqrt{\frac{1}{M^2}-1}\tag 3[/math]
The acquisition of FD FLIM measurements is illustrated using the ISS Alba Fast FLIM system (ISS Inc., Champaign, IL) coupled to an Olympus IX71 microscope (Figure 2B).

The microscope is equipped with a 60X 1.2 numerical aperture water-immersion objective lens, an objective warmer, and a stage-top environmental control system to maintain the temperature and [math]CO_{2}[/math] levels of the sample. A 5 mW 440 nm diode laser was modulated by the Alba Fast FLIM system at a fundamental frequency of 10 MHz, with additional measurements at 13 harmonics (20-140 MHz). The modulated laser is coupled to the confocal scanning system that is controlled by the Vista Vision software (ISS Inc., Champaign, IL). The fluorescence signals emitted from the specimen are routed by a 495 nm long-pass beam splitter to two separate detection channels using band-pass emission filters (here, 480/40 nm and 530/43 nm) and the signals are detected using two identical avalanche photodiodes (APD) (Figure 2B).
2 2.1.FD FLIM Measurements
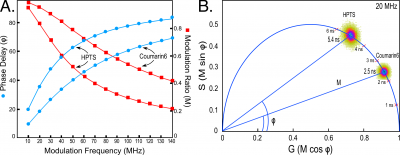
Here, the FD FLIM system is used to measure the lifetimes for Coumarin 6 dissolved in ethanol and HPTS (8-hydroxypyrene-1, 3, 6-trisulfonic acid) dissolved in phosphate buffer (pH 7.8). The dyes are added to separate chambers on a cover glass(Lab-Tek II cover glass, Thermo Fisher Scientific, Waltham, MA), and confocal images are acquired with the modulated 440 nm diode laser. The [math]\Phi[/math] and [math]M[/math] of the emission signal at each image pixel are acquired simultaneously at each harmonic frequency. The Vista Vision software(ISS Inc., Champaign, IL) displays the multi-frequency response curves, shown in Figure 3A, which measures both the phase shift and demodulation for each modulation frequency. The fitting of the data is evaluated using the chi-squared ([math]\chi ^2[/math]) distribution to assess the discrepancy between the observed values and the values expected under statistical models. The Vista Vision software uses the Levenberg-Marquardt algorithm for the minimization of the [math]\chi ^2[/math] function, and this permits the determination of the fractional components for multi-exponential decays. The calculated [math]\chi^2[/math] also supplies critical information about potential systematic error in the data or poor signal-to-noise ratio. The chi-square analysis of the multi-frequency response curves for Coumarin 6 and HPTS demonstrates that the decays for both dyes are best characterized as single exponential (Figure 3A).
3 Phasor Plots

The Vista Vision software (ISS Inc., Champaign, IL) is then used to generate phasor plots, shown in Figure 3B.The phasor plots a simple geometric representation of the [math]\Phi[/math] and the [math]M[/math] of an emission signal at a particular frequency [9-11].The phasor plot maps the [math]\Phi[/math] and the [math]M[/math] from each image pixel to the Fourier transform components G and S:
[math]G = M cos\Phi[/math] and [math]S=M sin\Phi\tag 4[/math]
usin g vectors with angless pecified by the [math]\Phi[/math] and lengths determined by [math]M[/math]. In this regard the phasor plot can be thought of as a histogram of the image pixels with the same phasor coordinates, thus providing a global view of the fluorescence decay at each pixel of an image. For fluorophores with single-component decays, the relationship [math]M=cos\Phi[/math] describes a vector with an endpoint falling somewhere on a universal semicircle, irrespective of the modulation frequency or lifetime. The distribution of lifetimes for a species with a short lifetime will fall to the right on the semicircle, while those with longer lifetimes will move to the left along the semicircle. Here, the lifetime distributions for both Coumarin 6 and HPT Sare shown on a composite phasor plot for measurements acquired at 20 MHz (Figure 3B). The lifetime distribution for all image pixels (the image size was 256 x 256 pixels, for a total of 65,536 pixels) is plotted relative to a universal semicircle, using color to indicate the incidence of lifetime values from blue (highest) to red to yellow (lowest). The lifetime distribution for Coumarin 6 falls on the universal semicircle, indicating a single-component decay, with the highest incidence of pixels at 2.5 ns(Figure 3B). The lifetime distribution for HPTS also falls on the semicircle, but is shifted to the left along semicircle relative to Coumarin 6 indicating a single-component lifetime of 5.4 ns (Figure 3B).
4 Phasor Analysis of Complex Lifetime Decays

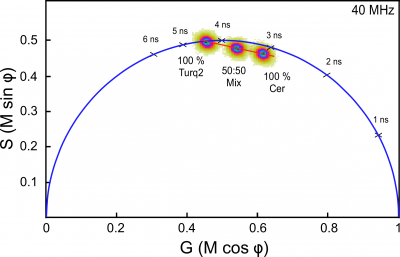
The lifetime distributions for fluorophores with multi-exponential decays will fall inside the phasor semicircle, and this is diagnostic for when minimization of the [math]\chi^2[/math] function should be used to determine the fractional components. Similarly, the lifetime distribution for a mixture of fluorophores will also lie within the semicircle, and is positioned between the distributions for each of the individual lifetime species. This allows the relative contributions of the individual species in a mixture to be quantified [11]. To demonstrate this, FD FLIM was used to measure solutions ofthe purified fluorescent proteins (FPs) mCerulean or mTurquoise2 (m indicates monomeric), or a mixture of the two. The mTurquoise2 FP is an engineered variant of mCerulean that has a markedly improved quantum yield (0.93 vs. 0.49 for mCerulean) [12]. The increased quantum yield of mTurquoise2 causes it to have a longer fluorescence lifetime compared to mCerulean [13]. The composite phasor plot in Figure 4 showst hat the two purified FPs with identical emission spectra have clearly distinct lifetime distributions. The distribution for mTurquoise2 lies on the semicircle shifted to the left relative to mCerulean, indicating its longer single-exponential lifetime decay of 4.5 ns. In contrast, the lifetime distribution for mCerulean falls inside the universal semicircle, and this is diagnostic for the presence of more than one lifetime component (Figure 4). The [math]\chi^2[/math] analysis of the multi-frequency response curve acquired for mCerulean indicated it was best fit by a two-component decay, with fractional lifetimes of 4.8 ns (34%) and 2.1 ns (66%), resulting in an intensity-weighted average lifetime of 3.1 ns [14]. Although these two FPs have identical spectra, their distinct phasor locations allow their relative contributions in a mixture to be quantified. The location of the lifetime distribution for a 50:50 mixture of the FPs falls on a straight line directly between the distributions for the two different pure species (Figure 4).Together, these results demonstrate how the phasor plot analysis enables the direct visualization of complex lifetime decays, and allows the separation and quantification of distinct lifetime species in mixtures.
5 FLIM Measurements in Living Cells
Because FLIM measurements are made in the timedomain, they are unaffected by variations in probe concentration, changes in the excitation intensity, and are minimally affected by light scattering (provided there is adequate signal) [8].The combination of FD FLIM measurements and phasor analysis described here enables a variety of quantitative approaches to interrogate events inside living cells. For example, the FLIM approach with phasor analysis is an outstanding method to quantify Förster resonance energy transfer (FRET), and this enables measurements of the interactions between proteins inside living cells [14]. A distinct advantage of the phasor plot approach is that it allows the direct visualization of the multi-component lifetimes that occur in populations of proteins involved in FRET. Importantly, the phasor analysis can also be used to measure changes in intrinsic auto-fluorescence as an index of cellular metabolism in intact cells. Here, the application of FD FLIM to measurements of FRET to monitor protein-protein interactions, as well as measurements of intrinsic fluorescence lifetimes to monitor cellular metabolismis described.
6 FLIM Quantifies FRET
Since the fluorescence lifetime is an intrinsic property of every fluorophore, and it carries information about events that affect the excited-state. For example, FRET is a non-radiative quenching pathway by which a fluorophore in the excited-state (the donor) can transition to the ground state by transferring energy to another nearby molecule (the acceptor) [15, 16].This depletes the donor’s excited-state energy, which quenches its emission and reduces its fluorescence lifetime, and this change in the donor lifetime can be quantified by FLIM [14]. Because FLIM directly measures the quenching of the donor resulting from FRET, and does not require correction for spectral bleed through in the data analysis. This simplifies the interpretation of intermolecular FRET measurements compared to other methods [17], since the FRET efficiency ([math]E_{FRET}[/math]) is determined directly from the ratio of the unquenched donor lifetime ([math]\tau_{D}[/math]) to the quenched donor lifetime in the presence of the acceptor ([math]\tau_{DA}[/math]):
[math]E_{FRET}=1-\frac{\tau_{DA}}{\tau_{D}}\tag5[/math]
For intermolecular FRET measurements of protein-protein interactions, the donor- and acceptor-labeled proteins are produced in cells independently, so there will be a different ratio of the labeled proteins in each co-transfected cell. The donor-to-acceptor ratio [math](\frac{I_{A}{I_{D}})[/math]influences the [math]E_{FRET}[/math], since cells expressing predominately donor-labeled proteins will have little or no FRET, whereas cells with an excess of acceptor relative to the donor have the potential for high FRET signals [14]. Therefore, the [math](\frac{I_{A}{I_{D}})[/math] ratio must be taken into accounted in the analysis of data from intermolecular FRET experiments. The FLIM system used here has two separate emission channels to permit the simultaneous detection of the signals from the donor and the acceptor (Figure 3). By measuring the mean intensity in both the donor ([math]I_{D}[/math]) and the acceptor ([math]I_{A}[/math]) channels, the ratio of the acceptor- to the donor-labeled proteins can be determined for regions of interest (ROI) within the cells. This permits the [math]E_{FRET}[/math], determined by lifetime (Eq 5) to be plotted as a function of the [math]\frac{I_{A}}{I_{D}}[/math] ratiofor ROI within many different cells.