Thermoluminescence
by Dr. Adrie J. J. Bos[[1]].
Luminescence Materials Research Group, Delft University of Technology, Faculty of Applied Sciences, Mekelweg 15, NL 2629 JB Delft, The Netherlands.
Thermoluminesence (TL) also called Thermally Stimulated Luminescence (TSL) is the emission of light from an insulator or semiconductor when it is heated following a previous absorption of energy from an external source.[1]
Characteristic of a material that shows TL is that the material is capable of storing some energy, that is released in the form of light when the material is heated. It should be realized that the heating is just the trigger not the cause of the luminescence. The emission of TL is made possible by previous absorption of energy usually from ionisation radiation. Once a material is heated it will show no TL again simply by cooling the material and reheating. In order to show TL again the material has to be re-exposed to radiation. The time between exposure and readout, i.e. the heating of the material can vary from seconds to thousands of years. Thermoluminescence should be distinguished from black body radiation, the light spontaneously emitted from a substance when it is heated to incandescence. In this case no prior absorption of energy from an external source is necessary. Instead of heat, radiation in the visible or infra-red region can also be used the produce luminescence. In that case the phenomenon is called Optically Stimulated Luminescence (OSL).[2]
1 Explanation with a Simple Model

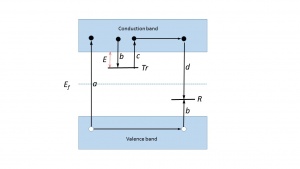
An explanation of the phenomenon is based on the energy band model of solids where each atom is subject to a periodic array of potential wells. Allowed energies for the electrons lie in allowed zones (valence band, conduction band). These bands constitute a ‘forbidden zone’ or ‘band gap’.However, whenever structural defects occur in a crystalline solid, or if there are impurities within the lattice, it becomes possible for electrons to possess energies which lie in the band gap. These so-called localized energy states play a crucial role in the TL mechanism. They act as trapping centres for the charge carriers which are freed during the exposure to radiation. In a simple TL model at least two levels are assumed (see Fig. 1). The highest level, indicated by [math]Tr[/math], is situated above the equilibrium Fermi level ([math]E_{f}[/math]) and thus empty in the equilibrium state, i.e. before the exposure to radiation and the creation of free electrons and holes. It is therefore a potential electron trap. The other level, indicated by R, is full at equilibrium and is a potential hole trap and can function as recombination centre. The absorption of radiant energy with energy greater than the band gap results in ionisation of valence electrons, producing energetic electrons and holes which will, after thermalization, produce free electrons in the conduction band and free holes in the valence band.A certain percentage of the freed charge carriers will be trapped: the electrons at Trand the holes at R(transitions b). There is a certain probability that the charge carriers escape from their traps due to thermal stimulation. The probability per unit time of release of an electron from the trap is assumed to be described by the Arrhenius equation:
[math]p=s\exp\left (-\frac{E}{kT} \right ) \tag{1} [/math]
where p is the probability per unit time. The pre-exponential factor s is called the frequency factor or attempt-to-escape factor. In the simple model s is considered as a constant (not temperature dependent) with a value in the order of the lattice vibration frequency, namely [math]10^{12} – 10^{14}s^{-1}[/math]. E is called the trap depth or activation energy, the energy needed to release an electron from the trap into the conduction band (see Fig. 1). The other symbols have their usual meaning; k = Boltzmann’s constant = [math]8.61710\times 10^{-5}\frac{eV}{K}[/math], and T the absolute temperature. The quantities E and s are called the trap parameters. Their values determine whether the electron will escape at a certain temperature T. In the simple model it is assumed that there is no quenching and no retrapping i.e. all electrons released into the conduction band gives rise to recombination under the emission of light. Let us denote n ([math]m^{-3}[/math]) as the concentration of trapped electrons and m ([math]m^{-3}[/math]) the concentration of holes trapped at R. Then the TL intensity, [math]I(t)[/math], in photons per unit volume and per unit time ([math]m^{-3}s^{-1}[/math]) at any time t during heating is proportional to the rate of recombination of holes and electrons at R and that is under the mentioned assumptions equal to the rate of thermal excitation of electrons from [math]Tr[/math] into the conduction band:
[math]I(t)=-\frac{dm}{dt}=-\frac{dn}{dt}=ns\exp \left ( -\frac{E}{kT} \right ) \tag{2}[/math]
This differential equation describes the charge transport in the lattice as a first-order process. Usually TL is observed as the temperature T is raised as a linear function of time t according to:
[math]T(t)=T_{0}+\beta t\tag{3}[/math]
with [math]\beta (Ks^{-1})[/math] a constant heating rate and [math]T_{0}[/math] the temperature at time [math]t=0[/math]. Solving Eq. (2) with this temperature profile leads to the well-known Randall-Wilkins equation:
[math]I(T)=-\frac{1}{\beta }\frac{dn}{dt}=n_{0}\frac{s}{\beta }\exp \left ( \frac{-E}{kT} \right )\exp\left [ -\frac{s}{\beta } \int_{T_{0}}^{T}\exp \left ( -\frac{E}{kT^{'}} \right )dT^{'}\right ] \tag{4} [/math]
with [math]n_{0}[/math] the total number of trapped electrons at [math]t=0[/math] and [math]T'[/math] a dummy variable. This equation describes the shape of a peak. Such a shape can be understood as follows. As the temperature increases the intensity initially increases because of the detrapping of the trapped charge carriers and consequent recombination which initiates luminescence, than the intensity reach a maximum and finally decreases as the number of charges carriers becomes depleted. The shape and the position of the peak maximum are governed by the trap parameters (material constants) and the heating rate (readout parameter). The explanation of TL so far relies on the simple one trap – one recombination centre model of Fig. 1. It leads to expression, Eq.(4), describing the primary TL features as the shape of the TL glow peak and its dependence upon trapped charge concentration, [math]n_{0}[/math], heating rate, [math]\beta[/math], and trap depth, E. Real TL materials contain usually multiple trappings and recombination centres. This leads to advanced models described in text books [3-5].
2 Characteristics
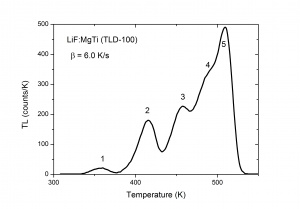
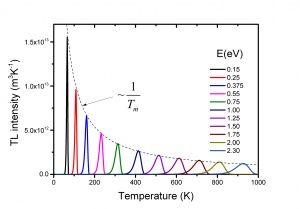
The TL intensity as function of the temperature is called a TL glow curve. Figure 2 shows an example for LiF:Mg,Ti, a well-known dosimetric TL material with trade name TLD-100. It shows five glow peaks numbered from 1 to 5 indicating that there are five trapping centres with different trap depth. In a first approximation the glow peak maximum is a measure of the trap depth. The deeper the trap, the more energy is needed to release the charge carrier, the higher the glow peak temperature. This is exemplified in Fig. 3 where calculated glow peaks are shown for different trap depths. We see that for deeper traps i) the glow peak temperature shifts to higher temperature ii) the luminescence is spread out over a wider temperature interval resulting in a broader glow peak. The area of the glow peak, the total intensity, remains the same. The intensity [math]I_{m}[/math] at the temperature of the glow peak maximum, [math]T_{m}[/math] is proportional to [math]n_{0}[/math], the initial electron concentration right after the irradiation and approximately reversely proportional to [math]T_{m}[/math]. The shift of the glow peak temperature shows the sensitivity: for the parameters values in the figure a difference in trap depth of only 0.05 eV gives a difference in glow peak temperature of 20 K. The phenomenon is also sensitive in the sense that the number of trapping centres needed to detect TL is low. Defects densities as low as [math]10^{7} cm^{-3}[/math] can produce a measurable TL signal, whereas techniques such as Electron Paramagetic Spectroscopy (EPR) and Optical Absorption Spectroscopy (OAS) are sensitive only for relatively higher defect concentrations of [math]10^{12}cm^{-3}[/math]or more [6]. Thermoluminescence is not a phenomenon that is observed in only a few, rare materials. Radiation-induced thermoluminescence is a phenomenon widely observed in natural substances. This has to do with the fact that natural substances like quartz and feldspars always have defects which can act a trapping centres for charge carriers and luminescent centres which produce light after excitation. Their sensitivity (TL per unit dose) is in general low. Artificial synthesized TL materials can have a high sensitivity. The most popular thermoluminescence materials in use today are described by McKeever, Moscovitch, and Townsend [7].
3 Applications of Thermoluminescence
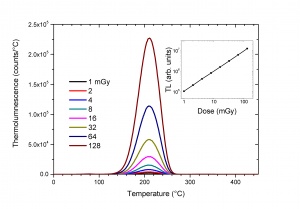
The most important application of TL is in the field of radiation dosimetry. It is based on the property that for certain TL materials the number of trapped electrons is proportional to the absorbed dose D delivered during the exposure to the external radiation source. The measurement of the intensity of the thermoluminescence can therefore be used to determine the absorbed dose(see Fig. 4). The relation between D and the TL intensity contains many complicating factors determined by the radiation type, the exposure conditions, the TL material, the history of the TL material and the way how the TL material is read out. This excludes absolute dosimetry but it can very well be used in relative dosimetry by calibrating the TL material under well-defined exposure conditions.The sensitivity and wide dynamic range of TL (from [math]\mu Gy[/math] to [math]kGy[/math]) in this application are unrivalled by other dosimetric techniques. TL has therefore found application in personnel, environmental, medical and retrospective dosimetry.
Another application of TL is in dating of archaeological (e.g. pottery) and geological (e.g. sediments) samples. The principle is based on the fact that minerals in those samples receive a dose due to their prolonged exposure to radiation from radionuclides like potassium-40, thorium and uranium. The concentration of these naturally occurring radionuclides in the surroundings is very low, in the ppm range, but prolonged exposure results in a measurable dose. The accumulated dose is presumed to be reset when the sample is heated (e.g. in firing the pottery) or when it is exposed to sunlight (e.g. sediments). The age can then be found using the following relation:
[math]Age(y)=\frac{TL\: acquired\: since\: reset}{TL\: per\: unit\: dose\times annual\: dose\: from\: surroundings}[/math]
Thermoluminescence is also used in material research. It is a valuable tool to evaluate the concentration and depth of the traps involved in energy storage processes. Quite often, a TL study is performed after illumination with a single wavelength. Studying the wavelength dependency of the trap filling can provide relevant information on the trapping pathway: non localized i.e. recombination via the conduction band or localized, recombination of electrons with nearby holes via tunneling. In this way TL helps to reveal the mechanism behind the luminescence process. Practical help in analyzing TL data can be found in [8].
4 References
[1] McKeever, Stephen WS. Thermoluminescence of solids. Vol. 3. Cambridge University Press, 1988.
[2] Yukihara, E.G., and S.W.S. McKeever. 2011. Optically Stimulated Luminescence - Fundamentals and Applications. Singapore: John Wiley & Sons.
[3] Chen, Reuven, and Stephen WS McKeever. Theory of thermoluminescence and related phenomena. World Scientific, 1997.
[4] Chen, Reuven, and Vasilis Pagonis. 2011. Thermally and Optically Stimulated Luminescence - A Simulation Approach. Chichester, West Sussex: John Wiley.
[5] Sunta, C. M. 2015. Unraveling Thermoluminescence. Springer Series in Materials Science. Vol. 202. New Delhi: Springer India. doi:10.1007/978-81-322-1940-8.
[6] Murthy, K.V.R., and H. S. Virk. 2014. “Luminescence Phenomena: An Introduction.” Defect and Diffusion Forum 347: 1–34. doi:10.4028/www.scientific.net/DDF.347.1.
[7] McKeever, S. W. S., M. Moscovitch, and P. D. Townsend. 1995. Thermoluminescence Dosimetry Materials : Properties and Uses. Ashford: Nuclear Technology Pub.
[8] Pagonis, Vasilis, George Kitis, and Claudio Furetta. 2006. Numerical and Practical Exercises in Thermoluminescence. Springer.


