Phasor Approach to Fluorescence Lifetime Imaging Microscopy
Enrico Gratton[math]^{1}[/math] and David M. Jameson[math]^{2}[/math]
[math]^{1}[/math]Laboratory for Fluorescence Dynamics, Professor of Biomedical Engineering, University of California, Irvine. Natural Sciences II, Irvine, CA 92697, USA.
[math]^{2}[/math]Professor of Cell and Molecular Biology, University of Hawai’i at Manoa, John A. Burns School of Medicine 651 Ilalo Street, BSB 222, Honolulu, HI 96813 USA.
1 Brief history
The concept of phasor to describe the fluorescence decay was first introduced by Jameson, Gratton and Hall in 1984.[1] Several other equivalent derivations were later developed by other authors using different names.[2, 3] The term phasor is commonly used in other fields of science and predates its use in the field of fluorescence decay analysis. For example phasors have been used for the analysis of dielectric relaxations and mechanical relaxations among others.[4] Traditionally, the concept of phasor is associated with sinusoidal excitation and the “phasor: describes the change of phase and amplitude of the response of the system to the sinusoidal excitation. More generally, a phasor can be used to describe the response of a system for each of the harmonics of a periodic excitation. In the fluorescence field, given that the concept of phasor was originally related to periodic excitation it was naturally to use phasors to describe the response of a fluorescent sample in response to periodic excitation. For this reason, the phasor analysis of fluorescence decay was developed in connection with the frequency-domain methods in the fluorescence lifetime field. Historically, in the fluorescence time-domain field, the excitation source was not periodic, or the period was very longand the methods of decay analysis based on curve fitting were universally used. Since the origin of frequency-domain methods, the community using this approach was attracted by the simplicity of the data analysis in the frequency domain with respect to the time domain. With the advent of high repetition periodic pulsed laser sources in the ’90s, the two traditional areas of data collection and analysis, frequency-domain and time-domain, started to converge. This field further developed for microscopy in the laser scanning or wide field microscopes where the fluorescence decay is measured at a very large number of pixels. For applications to image analysis, the differences between the simplicity and speed of the frequency-domain methods for the analysis of fluorescence decay compared to the time-domain analysis made a difference. It became clear that in the biological samples commonly used in microscopy, the identification of molecular species with complex fluorescence decays was impractical since it required the resolution of several exponential components at each pixel of an image and the simple phasor analyses could convey the information contained in images in a straightforward visualization without resolving exponential components.
2 The phasor transformation of the intensity decay and the phasor plot
Given a periodic excitation source with period [math]T[/math] and a decay of the fluorescence intensity given by [math]I(t)[/math], we construct a phasor by defining the following phasor components indicated with the letters [math]G[/math] and [math]S[/math]
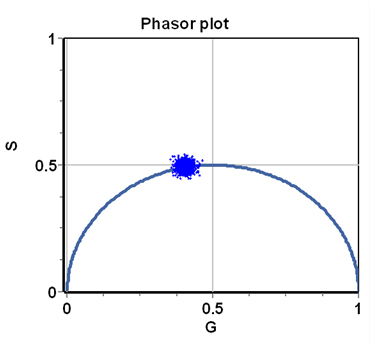
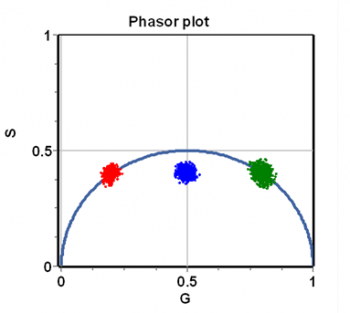
The integrals (or sums) are done over a period of the excitation source, [math]n\omega[/math] represents the [math]n-th[/math] harmonic of the periodic function describing the excitation frequency, [math]\omega=2\pi f[/math] is the angular excitation frequency and [math]f[/math] is the frequency of the periodic source. The index i indicates the [math]i-th[/math] pixel of an image. In the phasor approach, the coordinates G and S are plotted in a polar plot called the phasor plot. There is a phasor point associated with each pixel of an image. An example of a phasor plot is shown in Figure 1.
Comments: In the definition of the phasor coordinates, the integral is over one entire period of the periodic excitation source. If data are not available over the entire period, different values of the phasor coordinates will be obtained [5] giving rise to systematic errors. This consideration is important since common commercial time-domain acquisition systems are set to provide only part of the source period. Another source of systematic error is due to the collection of the function [math]I(t)[/math] in a limited number of bins in a period. These systematic errors could be accounted for by using expressions for the intensity decay that take into account the specific hardware used for data collection [5].
3 The universal semicircle
If the decay is exponential (or a sum of exponentials) the integrals of equations 1 can be solved analytically giving the following terms (the integral was done up to infinity)
[math]\left\{\begin{matrix}G(\omega)=\int_{0}^{T}I(t)\cos (\omega t)dt)/\int_{0}^{T}I(t)dt \\S(\omega)=\int_{0}^{T}I(t)\sin (\omega t)dt)/\int_{0}^{T}I(t)dt \end{matrix}\right.\tag{2}[/math]
[math]I(t)=Ae^{-t/\tau }[/math]
[math]\left\{\begin{matrix}G(\omega)=A\frac{1}{1+(\omega\tau)^{2}} \\S(\omega)=A\frac{\omega\tau }{1+(\omega\tau)^{2}} \end{matrix}\right. \tag{3}[/math]
Given the coordinates [math]G[/math] and [math]S[/math] we can calculate the polar representation of the phasor by the following definitions
[math]\begin{matrix}\tan (\varphi )=S(\omega)/G(\omega)=\omega \tau _{\varphi } \\M=\sqrt{S^{2}(\omega)+G^{2}(\omega)}=1/\sqrt{1+\omega^{2}\tau _{M}^{2} } \end{matrix}\tag{4}[/math]
where we use the classical definitions of “tau-phase” and “tau-mod”
[math]\tau _{\varphi }=\frac{1}{\omega}\tan (\varphi ) \\ \tau _{M}=\frac{1}{\omega}\sqrt{1/M^{2}-1}\tag{5}[/math]
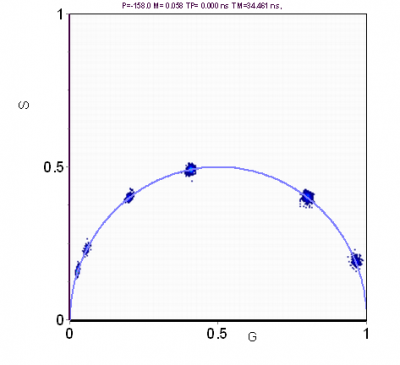
For a single exponential decay, tau-phase and tau-mod are identical and then using trigonometry [math]M=\cos(\phi).[/math] This relationship is valid for all points in a semicircle as shown in Figure 2. The semicircle is named the “universal semicircle” since all the decays arising by a single exponential must fall along the semicircle.
4 Position of a phasor in the phasor plot and fluorescence lifetime.
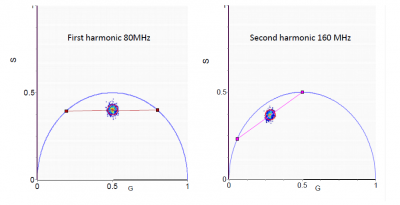
If the fluorescence decay arises from a single exponential, just reading the coordinates (or the phase and modulation values) in the phasor plot gives directly the value of the fluorescence lifetime. If the fluorescence arises from a double exponential decay then we use two harmonics of the periodic excitation to obtain graphically the values of the two components as shown in Figure 3. For each value of one component, the second value is systematically varied along the universal circle. For each pair of values the number of phasors that fall in the red circle is counted (Figure 3). The combination of lifetimes that give the larger number of phasors in the red circle is the best solution for this system. The radius of the red circle is chosen according to the photon statistics and it should contain 68% of all phasor points. The same principle can be used for 3 exponential components, in which case we need to use at least 3 harmonics.
5 Photon statistics and the error in the determination of the phasor position.
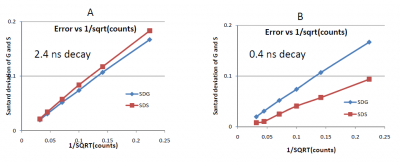
The statistical error in the phasor coordinates arises from the statistics of the intensity [math]I(t)[/math] and the value of the lifetime. From equations 2, the statistical error on the [math]g[/math] and [math]s[/math] coordinates is related to the total counts in the [math]I(t)[/math] curve. Since every photon can give rise to a phasor with a modulation of 1 and a phase between 0 and 90 degrees, the uncertainty in the determination of the phasor position depends on the number of photons under the curve. Precision depends on the square-root of the number of counts in the [math]I(t)[/math] curve. For example, if the curve contains 100 photons, the uncertainty of the coordinates [math]G[/math] and [math]S[/math] is about 10% of their value. Figure 4 shows the standard deviation of the phasor cluster for the [math]G[/math] and [math]S[/math] coordinates at different counts under the curve for a lifetime of 2.4 ns and 0.4 ns. When the original measurement is performed using the frequency domain method and the measurements of the phase and modulation are independent, then cluster of phasor values due to photon statistics is symmetric and independent of the actual value of the coordinates [math]G[/math] and [math]S[/math]. For data using the time domain histogram, the uncertainty in the values of the coordinates [math]G[/math] and [math]S[/math] depends on the value of the lifetime in addition to the total number of counts in the [math]I(t)[/math] curve.
6 Linear combination in the same pixel of species with complex decays.
From equations 2, we can derive the value of the coordinates of a phasor originating from a multiexponential decay using the fact that the integral of a sum is equal to the sum of the integrals. For example, consider the case of a system that has two exponential decays as indicated below
[math]\left\{\begin{matrix}G(\omega)=\int_{0}^{T}I(t)\cos (\omega t)dt)/\int_{0}^{T}I(t)dt \\S(\omega)=\int_{0}^{T}I(t)\sin (\omega t)dt)/\int_{0}^{T}I(t)dt \end{matrix}\right.\tag{6}[/math]
[math]I(t)=A_{1}e^{-t/\tau_{1}}+A_{2}e^{^{t/\tau_{2}}}[/math]
[math]\left\{\begin{matrix}G(\omega)=\left ( A_{1}\tau_{1}\frac{1}{1+(\omega\tau_{1})^{2}}+A_{2}\tau_{2}\frac{1}{1+(\omega\tau_{2})^{2}} \right )/(A_{1}\tau_{1}+A_{2}\tau_{2}) \\S(\omega)=\left ( A_{1}\tau_{1}\frac{\omega \tau_{1}}{1+(\omega\tau_{1})^{2}}+A_{2}\tau_{2}\frac{\omega \tau_{2}}{1+(\omega\tau_{2})^{2}} \right )/(A_{1}\tau_{1}+A_{2}\tau_{2}) \end{matrix}\right.\tag{7}[/math]
Using the definition of fractional intensity of a component we obtain
[math]f_{j}=A_{j}\tau_{j}/\sum_{j}A_{j}\tau_{j}[/math]
The result is that for the phasor coordinates, the exponential components add by combining them with their relative fractional intensity contribution. This trait is known as the “law of addition of phasors”. In Figure 2D we show the combination of two phasors corresponding to two exponential components. In the case of many components the same rule still applies extending the sum over all coordinate’s components.
[math]\left\{\begin{matrix}G(\omega)=\sum_{j}f_{j}g_{j}(\omega) \\ S(\omega)=\sum_{j}f_{j}s_{j}(\omega) \end{matrix}\right.\tag{9}[/math]
Finally, given a phasor that is produced by the sum of many exponential components and another phasor that is also due to the sum of many exponential components, the coordinates of the phasors that represent the linear combination of the two phasors follows exactly the same rule of component addition. Figure 5 shows the phasor of a dye of lifetime 1ns, 4 ns and their linear combination in the ratio 1:1 of fractional intensity. The linear combination falls exactly on the line joining the phasor of the 4ns and 1 ns dye, respectively.
7 The phasor plot of interacting molecules: FRET example
The law of linear combination of phasor of independent molecular species is not valid if the molecules are interacting. One common example is FRET (Fluorescence Resonance Energy Transfer) where the lifetime of the donor is affected by the presence of the acceptor. The change in the lifetime of the donor is given by the following relation
[math]\tau_{FRET}=\tau_{D}(1-E)\tag{10}[/math]
where [math]\tau_{D}[/math] is the lifetime of the donor, [math]\tau_{FRET}[/math] is the lifetime of the donor in the presence of the acceptor and [math]E[/math] is the FRET efficiency.
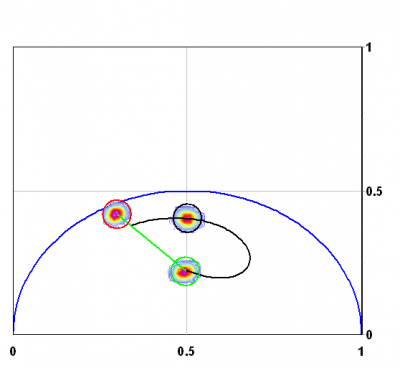
In the case in which all molecules in the pixel are subject to FRET, the phasor position will change position moving along the universal circle to the positon corresponding to the single exponential lifetime due to FRET. If only a fraction of molecules in a pixel is subject to FRET with a constant FRET efficiency [math]E[/math] then the phasor position will be the linear combination of a fraction of donor not fretting with a fraction of donor fretting. Since fretting molecules have a different contribution to the fluorescence, we must transform the fraction of molecules to a fractional contribution to the intensity to calculate the phasor position of this system where a fraction of donor molecules are not fretting. Figure 6 shows this case.
A more complex situation occurs if the donor is not single-exponential. In this case if we know that it is a double exponential decay, we can repeat the calculation for each lifetime component of the donor decay. If we don’t know the lifetime components of the donor, we can estimate the maximum and minimum value of these components by tracing the lines as shown in figure 6. Then we can apply the FRET equation to the maximum and minimum values of the lifetime. This procedure is shown in figure 6. To evaluate the maximum error introduced by this procedure we can calculate the possible families of curves obtained by solving the decay of the donor with every compatible combination of 2 lifetimes. As shown in figure 6 the range of possible values for the FRET curve is quite narrow and it depends on the distance of the donor decay from the universal circle. In practice, the distance of the phasor of the donor from the universal circle can be evaluated, and corrections can be applied if needed.
Frequency-domain lifetime measurements
8 References
1. Jameson DM, Gratton E, Hall R. The measurement and analysis of heterogeneous emissions by multifrequency phase and modulation fluorometry. App Spec Rev 1984;20:55-106
2. Hanley QS, Clayton AH. AB-plot assisted determination of fluorophore mixtures in a fluorescence lifetime microscope using spectra or quenchers. J Microsc. 2005;218(Pt 1):62-7.
3. Redford GI, Clegg RM. Polar plot representation for frequency-domain analysis of fluorescence lifetimes. J Fluoresc. 2005;15(5):805-15.
4. Dariani RS, Tavakoli F. Conductivity and relaxation time of porous silicon using the Kramers-Kronig relation. Physica B. 2015;456:312-20.
5. Fereidouni F, Esposito A, Blab GA, Gerritsen HC. A modified phasor approach for analyzing time-gated fluorescence lifetime images. J Microsc-Oxford. 2011;244(3):248-58.
